Exploring intersections of external data#
In this notebook, we walk through a series of case studies that explore the intersections of external data with ACDE datasets. More specifically, we investigate the intersections of AusStage and DAAO data with IMDb data, and the intersection of DAAO data with the AustLit database.
The work presented in relation to the former intersection form part of ACDE’s presentation at Clusters of Culture: Festivals, Mapping, and Data Visualisation., a symposium held in March 2023 with AusStage and Flinders University. While the work presented in relation to the latter intersection form part of ACDE’s presentation at the ASAL & ASLEC-ANZ 2023 Conference, an event held in July 2023.
AusStage, DAAO and IMDb#
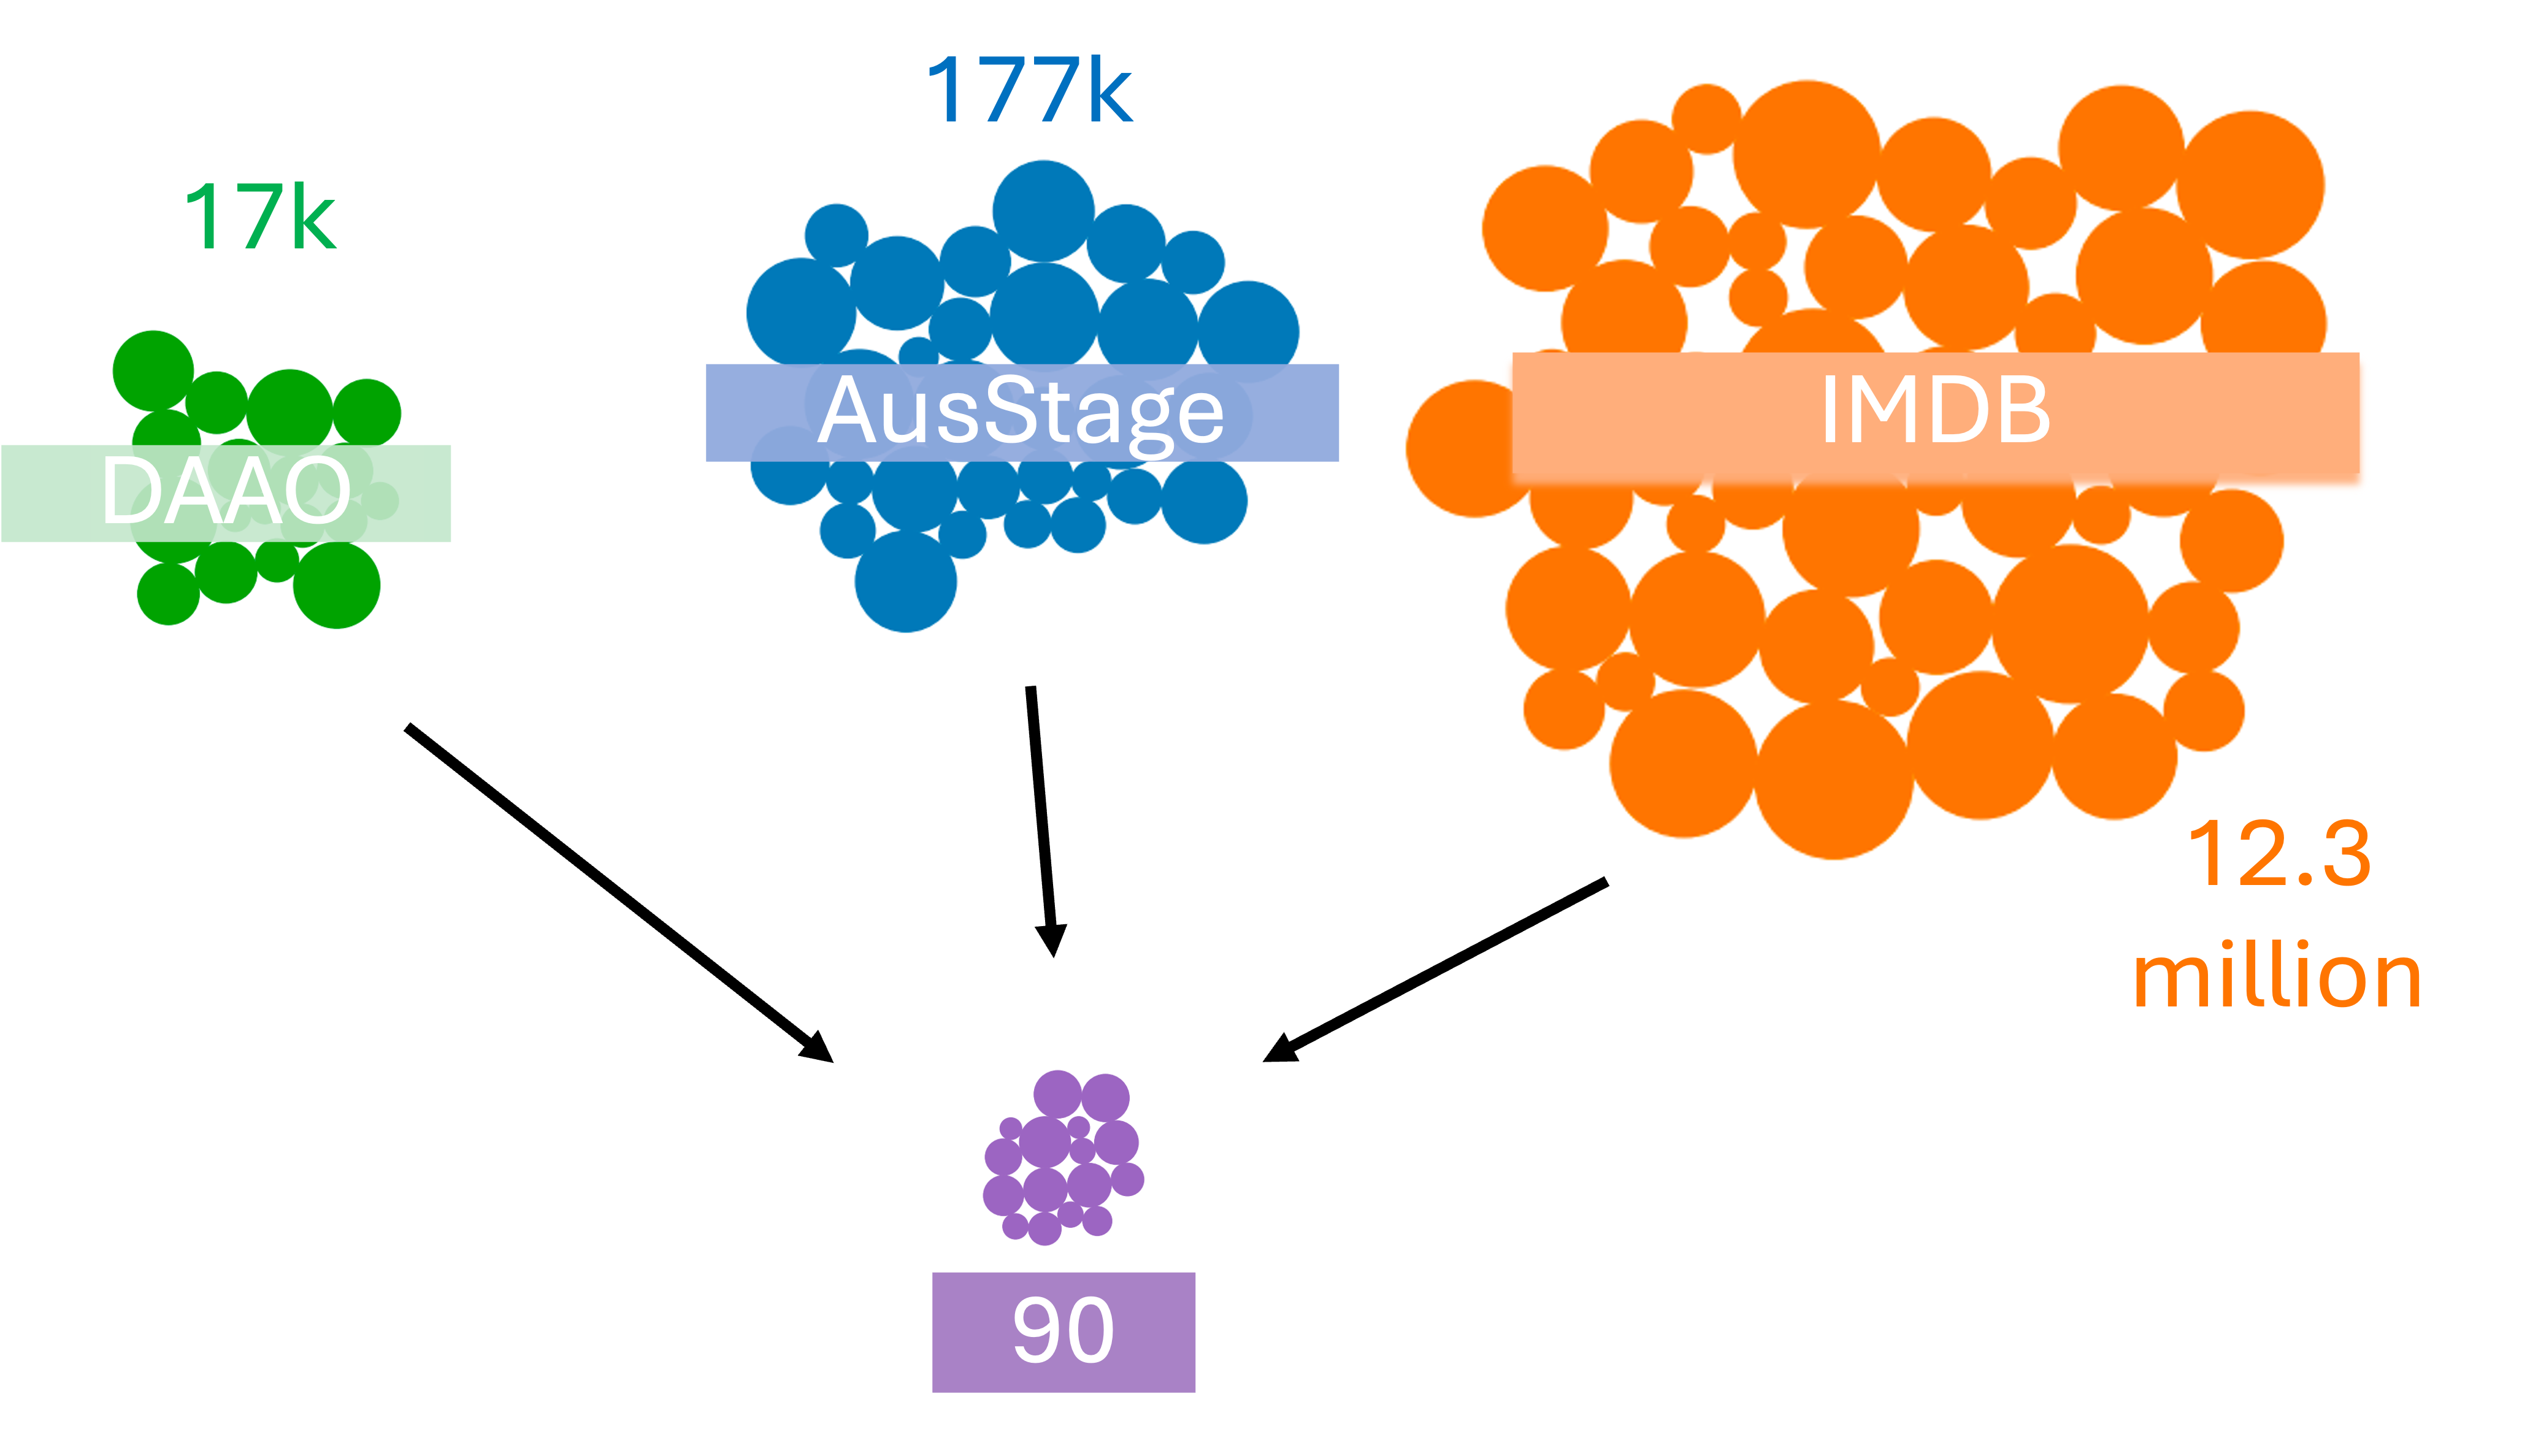
This investigation aims to exemplify the value of comparative visual methods that capture the nuanced trajectories of careers in the arts. We first generated a list of artists from the DAAO 500 that also exist in the AusStage database. This list of approximately 400 artists was then checked against the IMDb database to further extend the already merged dataset. This intersection reduced the number of artists to 90 artists based on exact matching of names, as shown in the below figure.
Show code cell source
from IPython.display import Image
Image(filename='images/images_analysis/ExternalDatasets_Intersection.png')
From this 90 artists, we selected four artists as case studies to explore the intersections of the three databases. The four artists selected were: George Gittoes, Bonita Ely, Maria Kozic and Toni Maticevski. These artists were selected based on their diverse artistic trajectories.
Show code cell source
# for data mgmt
import json
import pandas as pd
import numpy as np
from collections import Counter
from datetime import datetime
import os, requests, gzip, io
from bs4 import BeautifulSoup
import ast
import time

# for plotting
import matplotlib.pyplot as plt
import seaborn as sns
sns.set(style='white', context='paper')

from itables import show
from IPython.display import Image

import warnings
warnings.filterwarnings("ignore")

# provide folder_name which contains uncompressed data i.e., csv and jsonl files
# only need to change this if you have already donwloaded data
# otherwise data will be fetched from google drive
global folder_name
folder_name = 'data/local'

def fetch_small_data_from_github(fname):
    url = f"https://raw.githubusercontent.com/acd-engine/jupyterbook/master/data/analysis/{fname}"
    response = requests.get(url)
    rawdata = response.content.decode('utf-8')
    return pd.read_csv(io.StringIO(rawdata))

def fetch_date_suffix():
    url = f"https://raw.githubusercontent.com/acd-engine/jupyterbook/master/data/analysis/date_suffix"
    response = requests.get(url)
    rawdata = response.content.decode('utf-8')
    try: return rawdata[:12]
    except: return None

def check_if_csv_exists_in_folder(filename):
    try: return pd.read_csv(os.path.join(folder_name, filename), low_memory=False)
    except: return None

def fetch_data(filetype='csv', acdedata='organization'):
    filename = f'acde_{acdedata}_{fetch_date_suffix()}.{filetype}'

    # first check if the data exists in current directory
    data_from_path = check_if_csv_exists_in_folder(filename)
    if data_from_path is not None: return data_from_path

    download_url = None
    github_url = f"https://raw.githubusercontent.com/acd-engine/jupyterbook/master/data/{filename}.gz"

    if source == 'googledrive':
        urls = fetch_small_data_from_github('acde_data_gdrive_urls.csv')
        sharelink = urls[urls.data == acdedata][filetype].values[0]
        url = f'https://drive.google.com/u/0/uc?id={sharelink}&export=download&confirm=yes'

    elif source == 'github': url = github_url
    else: return None

    response = requests.get(url)

    try:
        sha = response.content.decode('utf-8').splitlines()[1].split('oid sha256:')[-1]
        size = response.content.decode('utf-8').splitlines()[2].split('size ')[-1]

        # Step 1: Create the JSON object
        json_data = {"operation": "download", "transfer": ["basic"], "objects": [{"oid": sha, "size": int(size)}]}

        # Step 2: Send a POST request to the LFS API
        url = "https://github.com/acd-engine/jupyterbook.git/info/lfs/objects/batch"
        headers = {"Accept": "application/vnd.git-lfs+json","Content-type": "application/json"}
        response = requests.post(url, headers=headers, data=json.dumps(json_data))
        response_json = response.json()

        # Step 3: Extract the download URL from the response
        download_url = response_json["objects"][0]["actions"]["download"]["href"]
    except:
        pass

    if download_url is not None: response = requests.get(download_url)

    decompressed_data = gzip.decompress(response.content)
    decompressed_buffer = io.StringIO(decompressed_data.decode('utf-8'))

    try:
        if filetype == 'csv': df = pd.read_csv(decompressed_buffer, low_memory=False)
        else: df = [json.loads(jl) for jl in pd.read_json(decompressed_buffer, lines=True, orient='records')[0]]
        return pd.DataFrame(df)
    except: return None

four_case_studies_df = fetch_small_data_from_github('DAAO_four_casestudies.csv')

print("A snapshot of the event data collected for the four case studies:")
four_case_studies_df.sample(10, random_state=102).sort_values(['Start', 'Person']).tail(7)
A snapshot of the event data collected for the four case studies:
| Event | Start | End | Country | Person | Dataset | Type | |
|---|---|---|---|---|---|---|---|
| 193 | Body Melt | 1993 | 1993 | Australia | Maria Kozic | IMDB | Work |
| 69 | PhD, University of Western Sydney, Sydney, NSW | 2002 | 2009 | Australia | Bonita Ely | DAAO | Training |
| 161 | National Sculpture Prize, National Gallery of ... | 2005 | 2005 | Australia | Bonita Ely | DAAO | Exhibitions |
| 58 | Soundtrack to War | 2005 | 2005 | Iraq | George Gittoes | IMDB | Work |
| 88 | Lake Thunder | 2006 | 2006 | Vietnam | Bonita Ely | DAAO | Exhibitions |
| 29 | The Miscreants of Taliwood | 2009 | 2009 | NaN | George Gittoes | DAAO | Work |
| 202 | Audience in Finale - Project Runway Australia | 2012 | 2012 | Australia | Toni Maticevski | IMDB | Work |
1. George Gittoes#
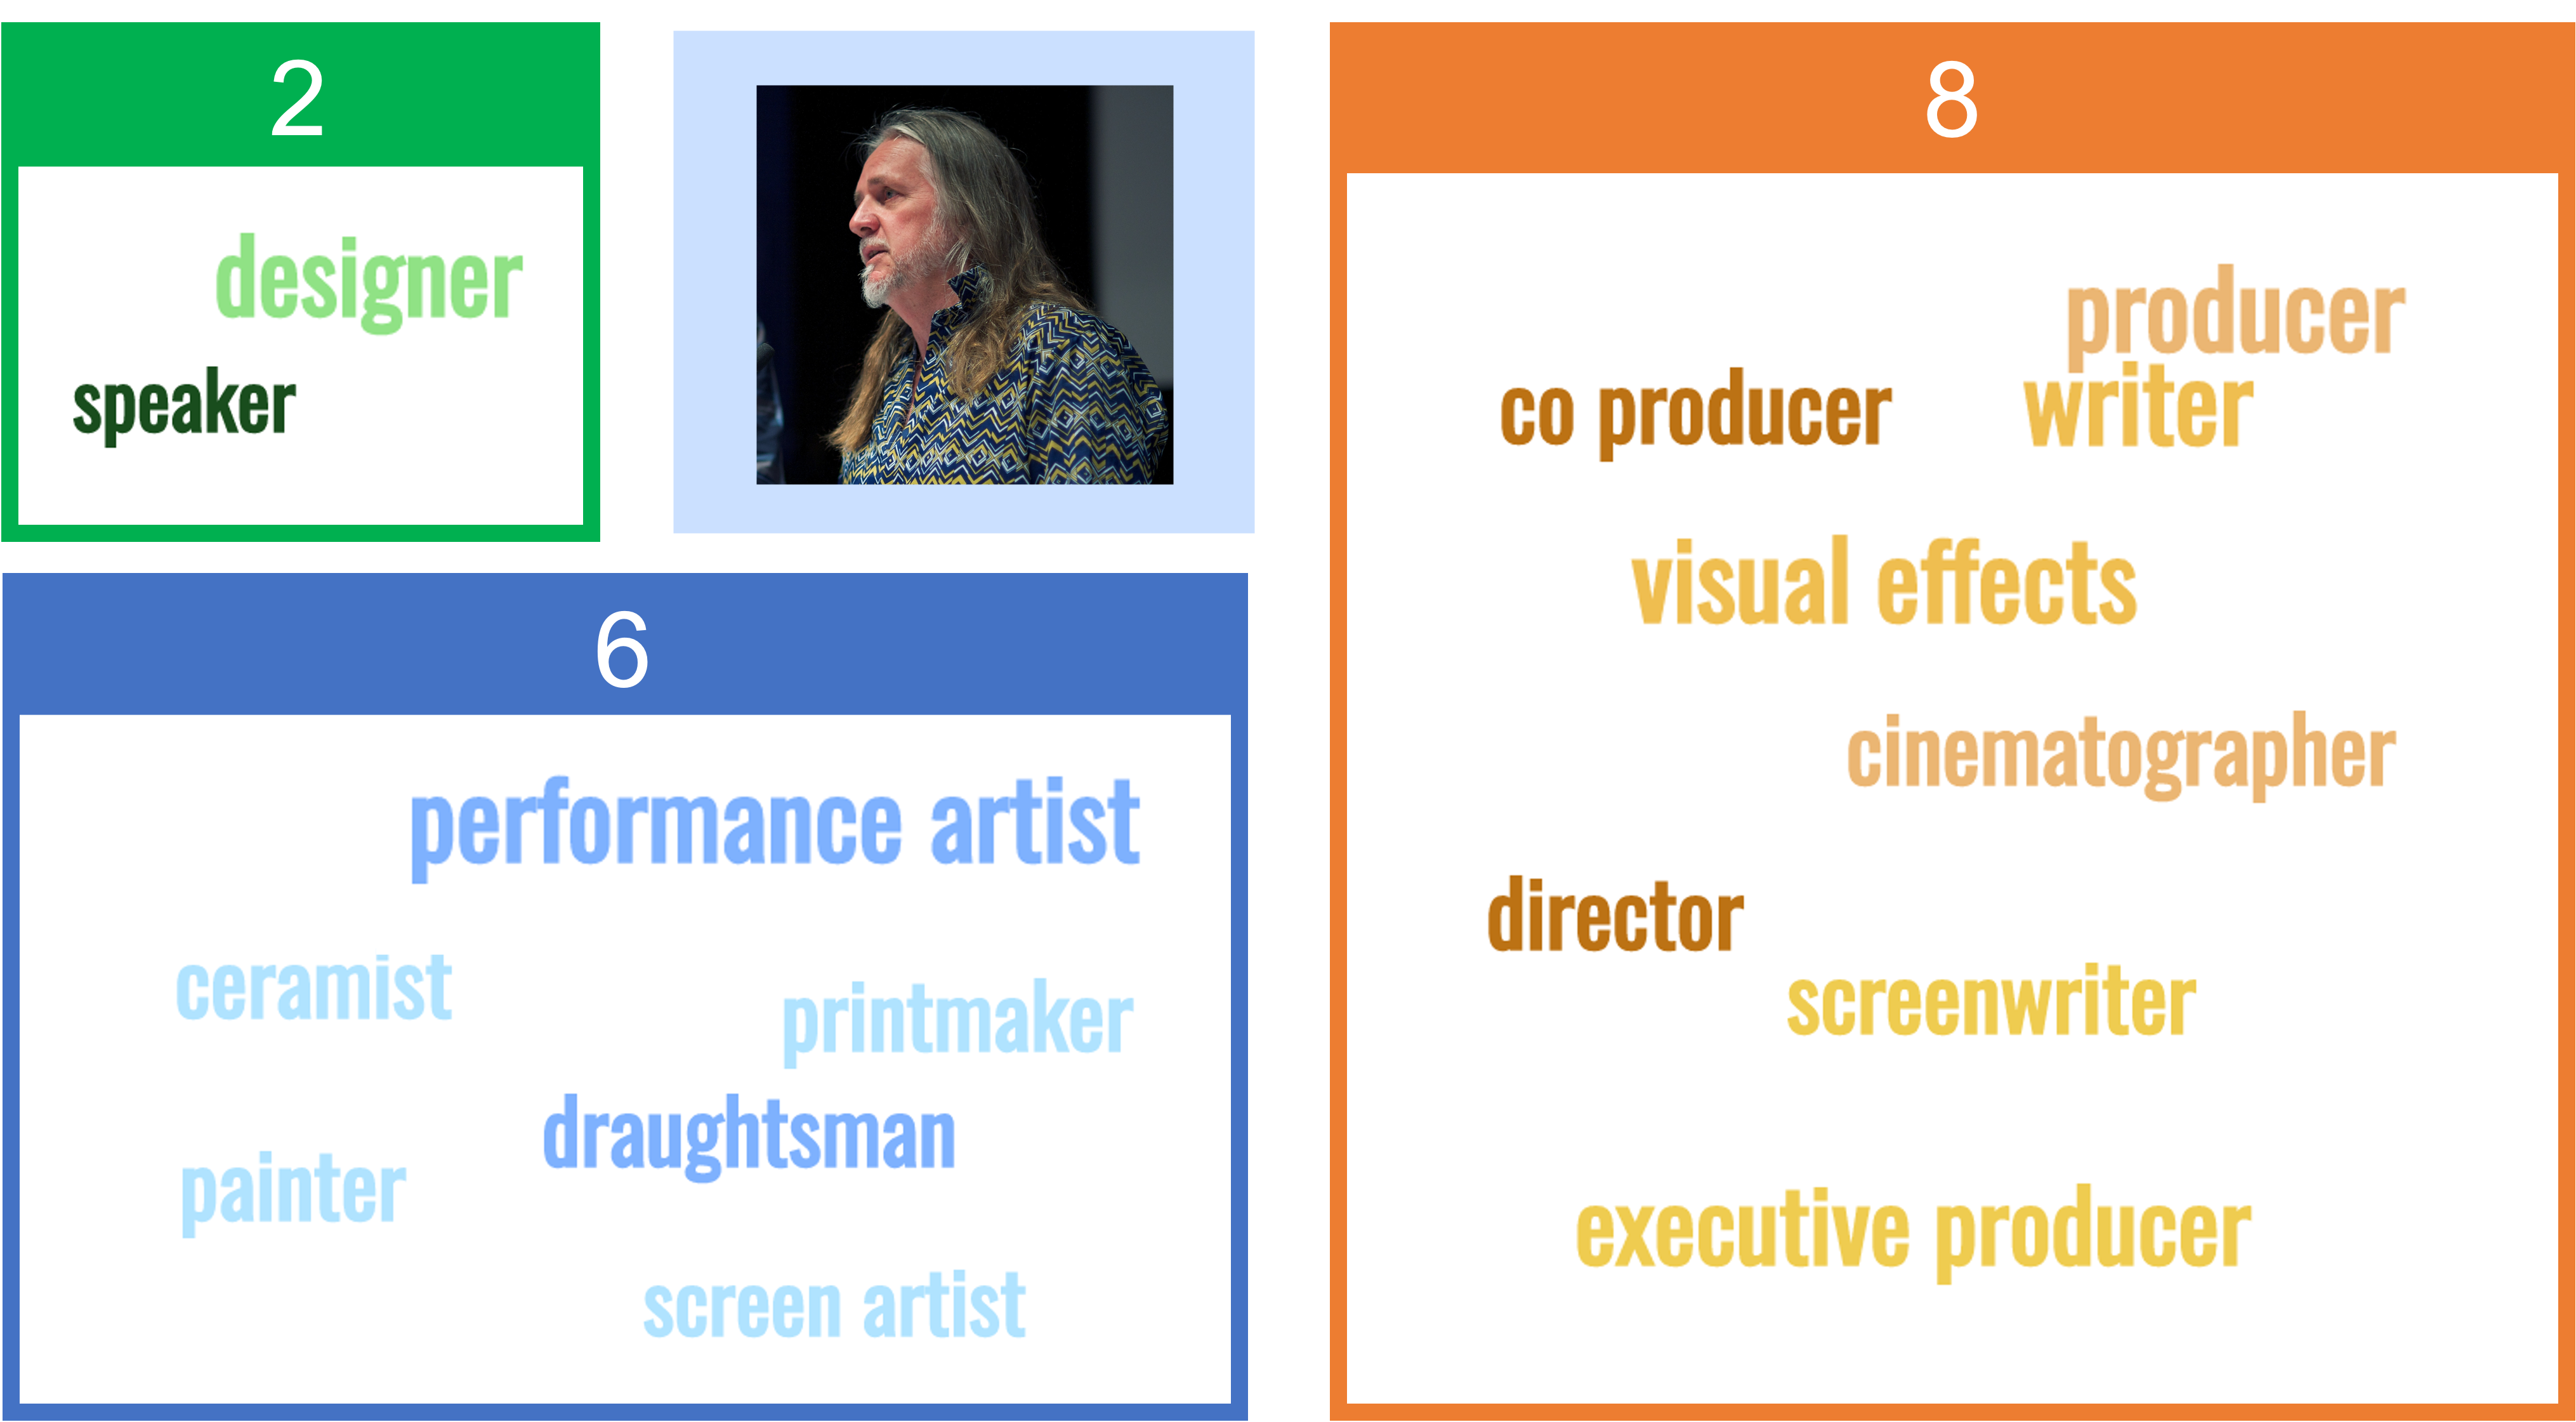
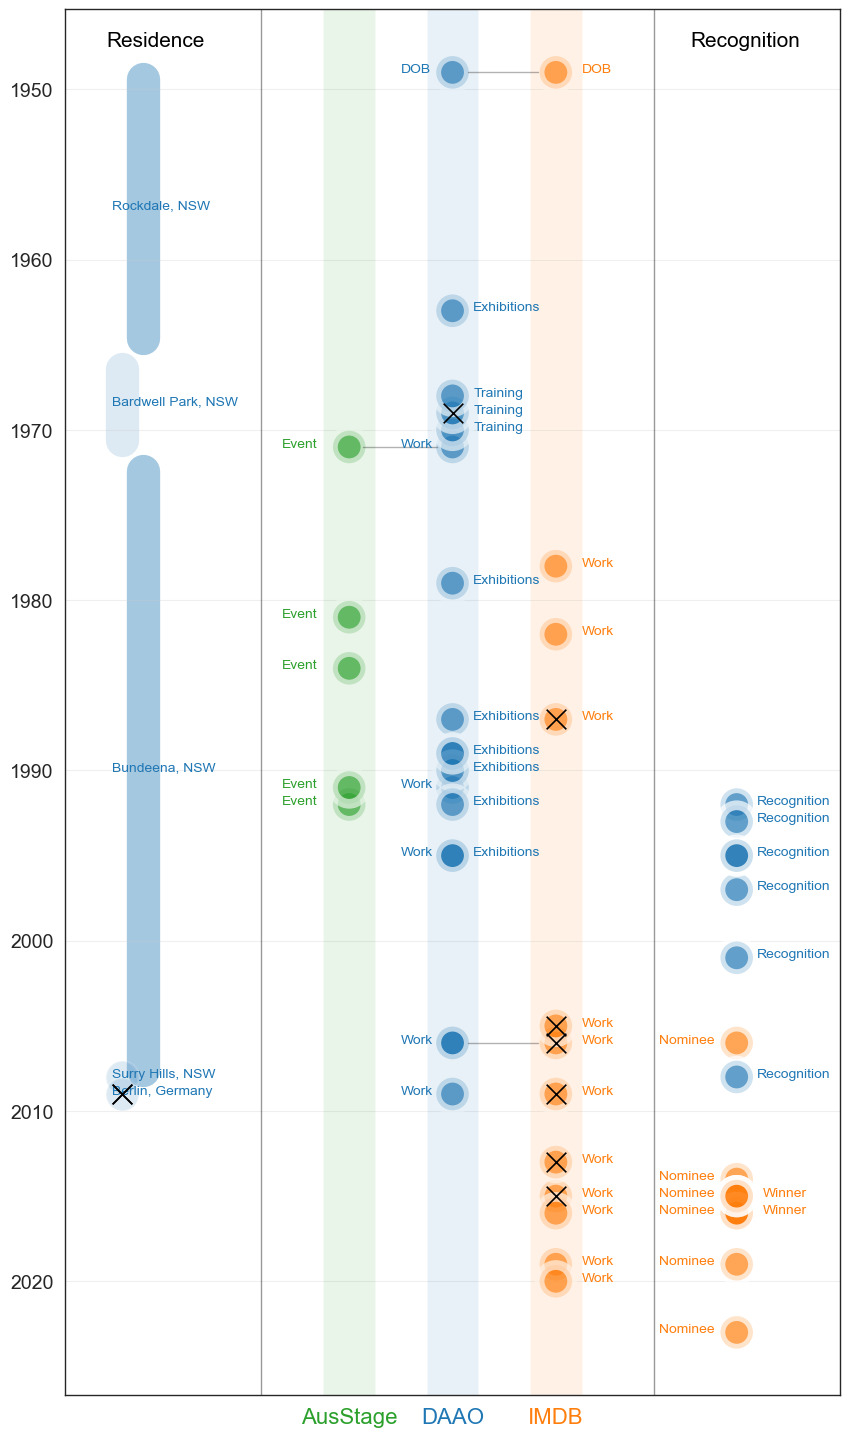
Painter, draughtsman, printmaker, film maker, performance artist, George Gittoes was one of the artists involved in Sydney’s Yellow House before creating a creative hub at Bundeena, south of Sydney. More than any other artist he has created a visual response to the early 21st century’s War on Terror and its human and spiritual consequence.
In the visual below, we show the number of roles recorded in AusStage (2), DAAO (6) and IMDb (8) for George Gittoes. In AusStage, George Gittoes is a designer and speaker. In DAAO, he is a performance artist, painter, ceramist, screen artist, draughtsman and printmaker. In IMDb, he is a director, producer, executive producer, co-producer, writer, cinematographer, visual effects and screenwriter.
Show code cell source
Image(filename='images/images_analysis/ExternalDatasets_George.png')
The data visualisation below summarises George Gittoes’s career trajectory as recorded across each dataset; green representing data points from AusStage, blue representing data points from DAAO and orange representing data points from IMDb. The plot also includes black crosses thats mark points of international presence.
Show code cell source
# change values with birth date to 'Birth'
four_case_studies_df['Type'] = np.where(four_case_studies_df['Type'] == 'Birth date', 'DOB', four_case_studies_df['Type'])
# george_df['Event'] = np.where(george_df['Event'] == 'Berlin, Germany', 'Berlin, \nGermany', george_df['Event'])

george_df = four_case_studies_df[four_case_studies_df.Person == 'George Gittoes']
g1 = george_df.copy()

ausstage = george_df[george_df.Dataset == 'AusStage'].reset_index(drop=True)
daao = george_df[george_df.Dataset == 'DAAO'].reset_index(drop=True)
imdb = george_df[george_df.Dataset == 'IMDB'].reset_index(drop=True)

g1 = g1[g1.Type != 'Residence']
g1_awards = g1[(g1.Type == 'Recognition') | (g1.Type == 'Winner') | (g1.Type == 'Nominee')]
g1 = g1[g1.Type != 'Winner']
g1 = g1[g1.Type != 'Nominee']
g1 = g1[g1.Type != 'Recognition']

fig, ax = plt.subplots(figsize=(10,18))
sns.scatterplot(data=g1.sort_values(['Dataset'], ascending=[True]),
x='Dataset', y='Start', hue='Dataset', ax=ax, s=550, alpha=0.7, linewidth=7,
palette=['tab:green','tab:blue','tab:orange'], legend=False)

plt.scatter(data=g1[(g1.Country != 'Australia') & (~g1.Country.isnull())].sort_values(['Dataset'], ascending=[True]),
            x='Dataset',y='Start', marker='x', color='black', s=200, zorder=10)

# change x-axis labels to be different colors
for label in ax.get_xticklabels():
    dataset_label = label.get_text()
    if dataset_label == 'AusStage': label.set_color('tab:green')
    elif dataset_label == 'DAAO': label.set_color('tab:blue')
    elif dataset_label == 'IMDB': label.set_color('tab:orange')

sns.scatterplot(data=g1_awards[g1_awards.Type != 'Recognition'].sort_values(['Dataset'], ascending=[True]),
x=3.75, y='Start', hue='Dataset', ax=ax, s=550, alpha=0.7, palette=['tab:orange'], legend=True,linewidth=7)

sns.scatterplot(data=g1_awards[g1_awards.Type == 'Recognition'].sort_values(['Dataset'], ascending=[True]),
x=3.75, y='Start', hue='Dataset', ax=ax, s=550, alpha=0.7, palette=['tab:blue'], legend=True, linewidth=7)

plt.legend(loc='lower left', fontsize=14, ncol=2, facecolor='white')
# for i in range(6): plt.gca().get_legend().legendHandles[i]._sizes = [200]

# make y-axis labels larger
plt.yticks(fontsize=14); plt.xticks(fontsize=16)
plt.ylabel(''); plt.xlabel('')

# add y-axis grid
plt.grid(axis='y', alpha=0.3)

# add a title
# plt.title("George Gittoes' career over time" , fontsize=16)
plt.title("")

# add higlighted rectangles centered at 0
plt.axvspan(-0.25, 0.25, facecolor='tab:green', alpha=0.1)
plt.axvspan(0.75, 1.25, facecolor='tab:blue', alpha=0.1)
plt.axvspan(1.75, 2.25, facecolor='tab:orange', alpha=0.1)


# add vertical line
# add a horizontal line  between the start and end of each person's career
for idx,p in enumerate(daao[daao['Type'] == 'Residence'].sort_values('Start')['Event'].unique()):
    start = daao[(daao['Event']==p)]['Start'].min()
    end = daao[(daao['Event']==p)]['End'].max()
    if (start==end) | (start+1==end):

        sns.scatterplot(data=daao[daao['Event']==p].sort_values(['Start'], ascending=[True]),
        x=-2.2, y='Start',hue='Event', ax=ax, s=550, alpha=0.15, palette=['tab:blue'], legend=False)

        plt.scatter(data=daao[(daao['Event']==p) & (daao.Country != 'Australia') & (~daao.Country.isnull())].sort_values(['Start'], ascending=[True]),
            x=-2.2,y=2009, marker='x', color='black', s=200, zorder=10)

    else:
        if idx % 2 == 0: plt.plot([-2,-2], [start+0.4, end-0.4], linewidth=24, zorder=0, color = 'tab:blue', alpha=0.4)
        else: plt.plot([-2.2,-2.2], [start+0.4, end-0.4], linewidth=24, zorder=0, color = 'tab:blue', alpha=0.15)


# add annottation above the vertical line
plt.annotate('Residence', (-2.35, g1['Start'].min()-1.5), fontsize=15, alpha=1, color='black')


# add annottation above the vertical line
plt.annotate('Recognition', (3.3, g1['Start'].min()-1.5), fontsize=15, alpha=1, color='black')


# add text labels for each Residence event
for idx,p in enumerate(daao[daao['Type'] == 'Residence'].sort_values('Start')['Event'].unique()):
    start = daao[(daao['Event']==p)]['Start'].min()
    end = daao[(daao['Event']==p)]['End'].max()
    if (start==end) | (start+1==end):
        ax.annotate(p, (-2.3, start), fontsize=10, alpha=1, color='tab:blue')
    else:
        if idx % 2 == 0: ax.annotate(p, (-2.3, (start+end)/2), fontsize=10, alpha=1, color='tab:blue')
        else: ax.annotate(p, (-2.3, (start+end)/2), fontsize=10, alpha=1, color='tab:blue')

daao = daao[daao.Type != 'Residence']

for idx,x in enumerate(ausstage['Type']):
    y = ausstage[ausstage.Type.str.contains(x)]['Start'][idx]
    ax.annotate(x, (-.65, y), fontsize=10, alpha=1, color='tab:green')

for idx,x in enumerate(daao['Type'].unique()):
    y = george_df[(george_df.Dataset == 'DAAO') & (george_df.Type.str.contains(x))]['Start'].unique()
    for y in george_df[(george_df.Dataset == 'DAAO') & (george_df.Type.str.contains(x))]['Start'].unique():
        z = george_df[(george_df.Dataset == 'DAAO') & (george_df.Type.str.contains(x)) & (george_df.Start == y)]['Start'].iloc[0]
        if (x == 'Recognition'): ax.annotate(x, (3.95, z), fontsize=10, alpha=1, color='tab:blue')
        else:
            if idx % 2 == 0: ax.annotate(x, (0.5, z), fontsize=10, alpha=1, color='tab:blue')
            else: ax.annotate(x, (1.2, z), fontsize=10, alpha=1, color='tab:blue')

for idx,x in enumerate(imdb['Type'].unique()):
    y = george_df[(george_df.Dataset == 'IMDB') & (george_df.Type.str.contains(x))]['Start'].unique()
    for y in george_df[(george_df.Dataset == 'IMDB') & (george_df.Type.str.contains(x))]['Start'].unique():
        z = george_df[(george_df.Dataset == 'IMDB') & (george_df.Type.str.contains(x)) & (george_df.Start == y)]['Start'].iloc[0]
        if (x == 'Nominee'): ax.annotate(x, (3, z), fontsize=10, alpha=1, color='tab:orange')
        elif (x == 'Winner'): ax.annotate(x, (4, z), fontsize=10, alpha=1, color='tab:orange')
        else:
            ax.annotate(x, (2.25, z), fontsize=10, alpha=1, color='tab:orange')

# change the order of the y-axis
plt.gca().invert_yaxis()

# add more space between the x-axis ticks
plt.xticks(np.arange(0, 10, 1))

# move legend to specific location
# plt.legend(loc='upper right', fontsize=12, ncol=1, facecolor='white', bbox_to_anchor=(0.965, 0.97))
# for i in range(2): plt.gca().get_legend().legendHandles[i]._sizes = [200]

# remove the legend
plt.legend().remove()

# add vertical lines on 0,1,2
plt.axvline(x=-.85, color='black', alpha=0.4, linestyle='-', linewidth=1)
plt.axvline(x=2.95, color='black', alpha=0.4, linestyle='-', linewidth=1)
# plt.axvline(x=0, color='lightgrey', alpha=0.4, linestyle='-', linewidth=1)
# plt.axvline(x=1, color='lightgrey', alpha=0.4, linestyle='-', linewidth=1)
# plt.axvline(x=2, color='lightgrey', alpha=0.4, linestyle='-', linewidth=1)

# add horizontal lines
plt.axhline(y=1949, color='black', alpha=0.3, linestyle='-', linewidth=1, xmin=0.52, xmax=0.61)
plt.axhline(y=1971, color='black', alpha=0.3, linestyle='-', linewidth=1, xmin=0.385, xmax=0.48)
plt.axhline(y=2006, color='black', alpha=0.3, linestyle='-', linewidth=1, xmin=0.52, xmax=0.61)


# # add annotation top right of plot to denote the vertical lines
# plt.annotate('| = annual break', xy=(2006.5, -.5), fontsize=12, alpha=0.5)

#remove y-axis title
plt.ylabel('')

# increase y-axis limits to make room for the title
plt.xlim(-2.75, 4.75)

# # save figure with 300 dpi
# plt.savefig('georgegittoes_timeline.png', dpi=330, bbox_inches='tight')

plt.show()
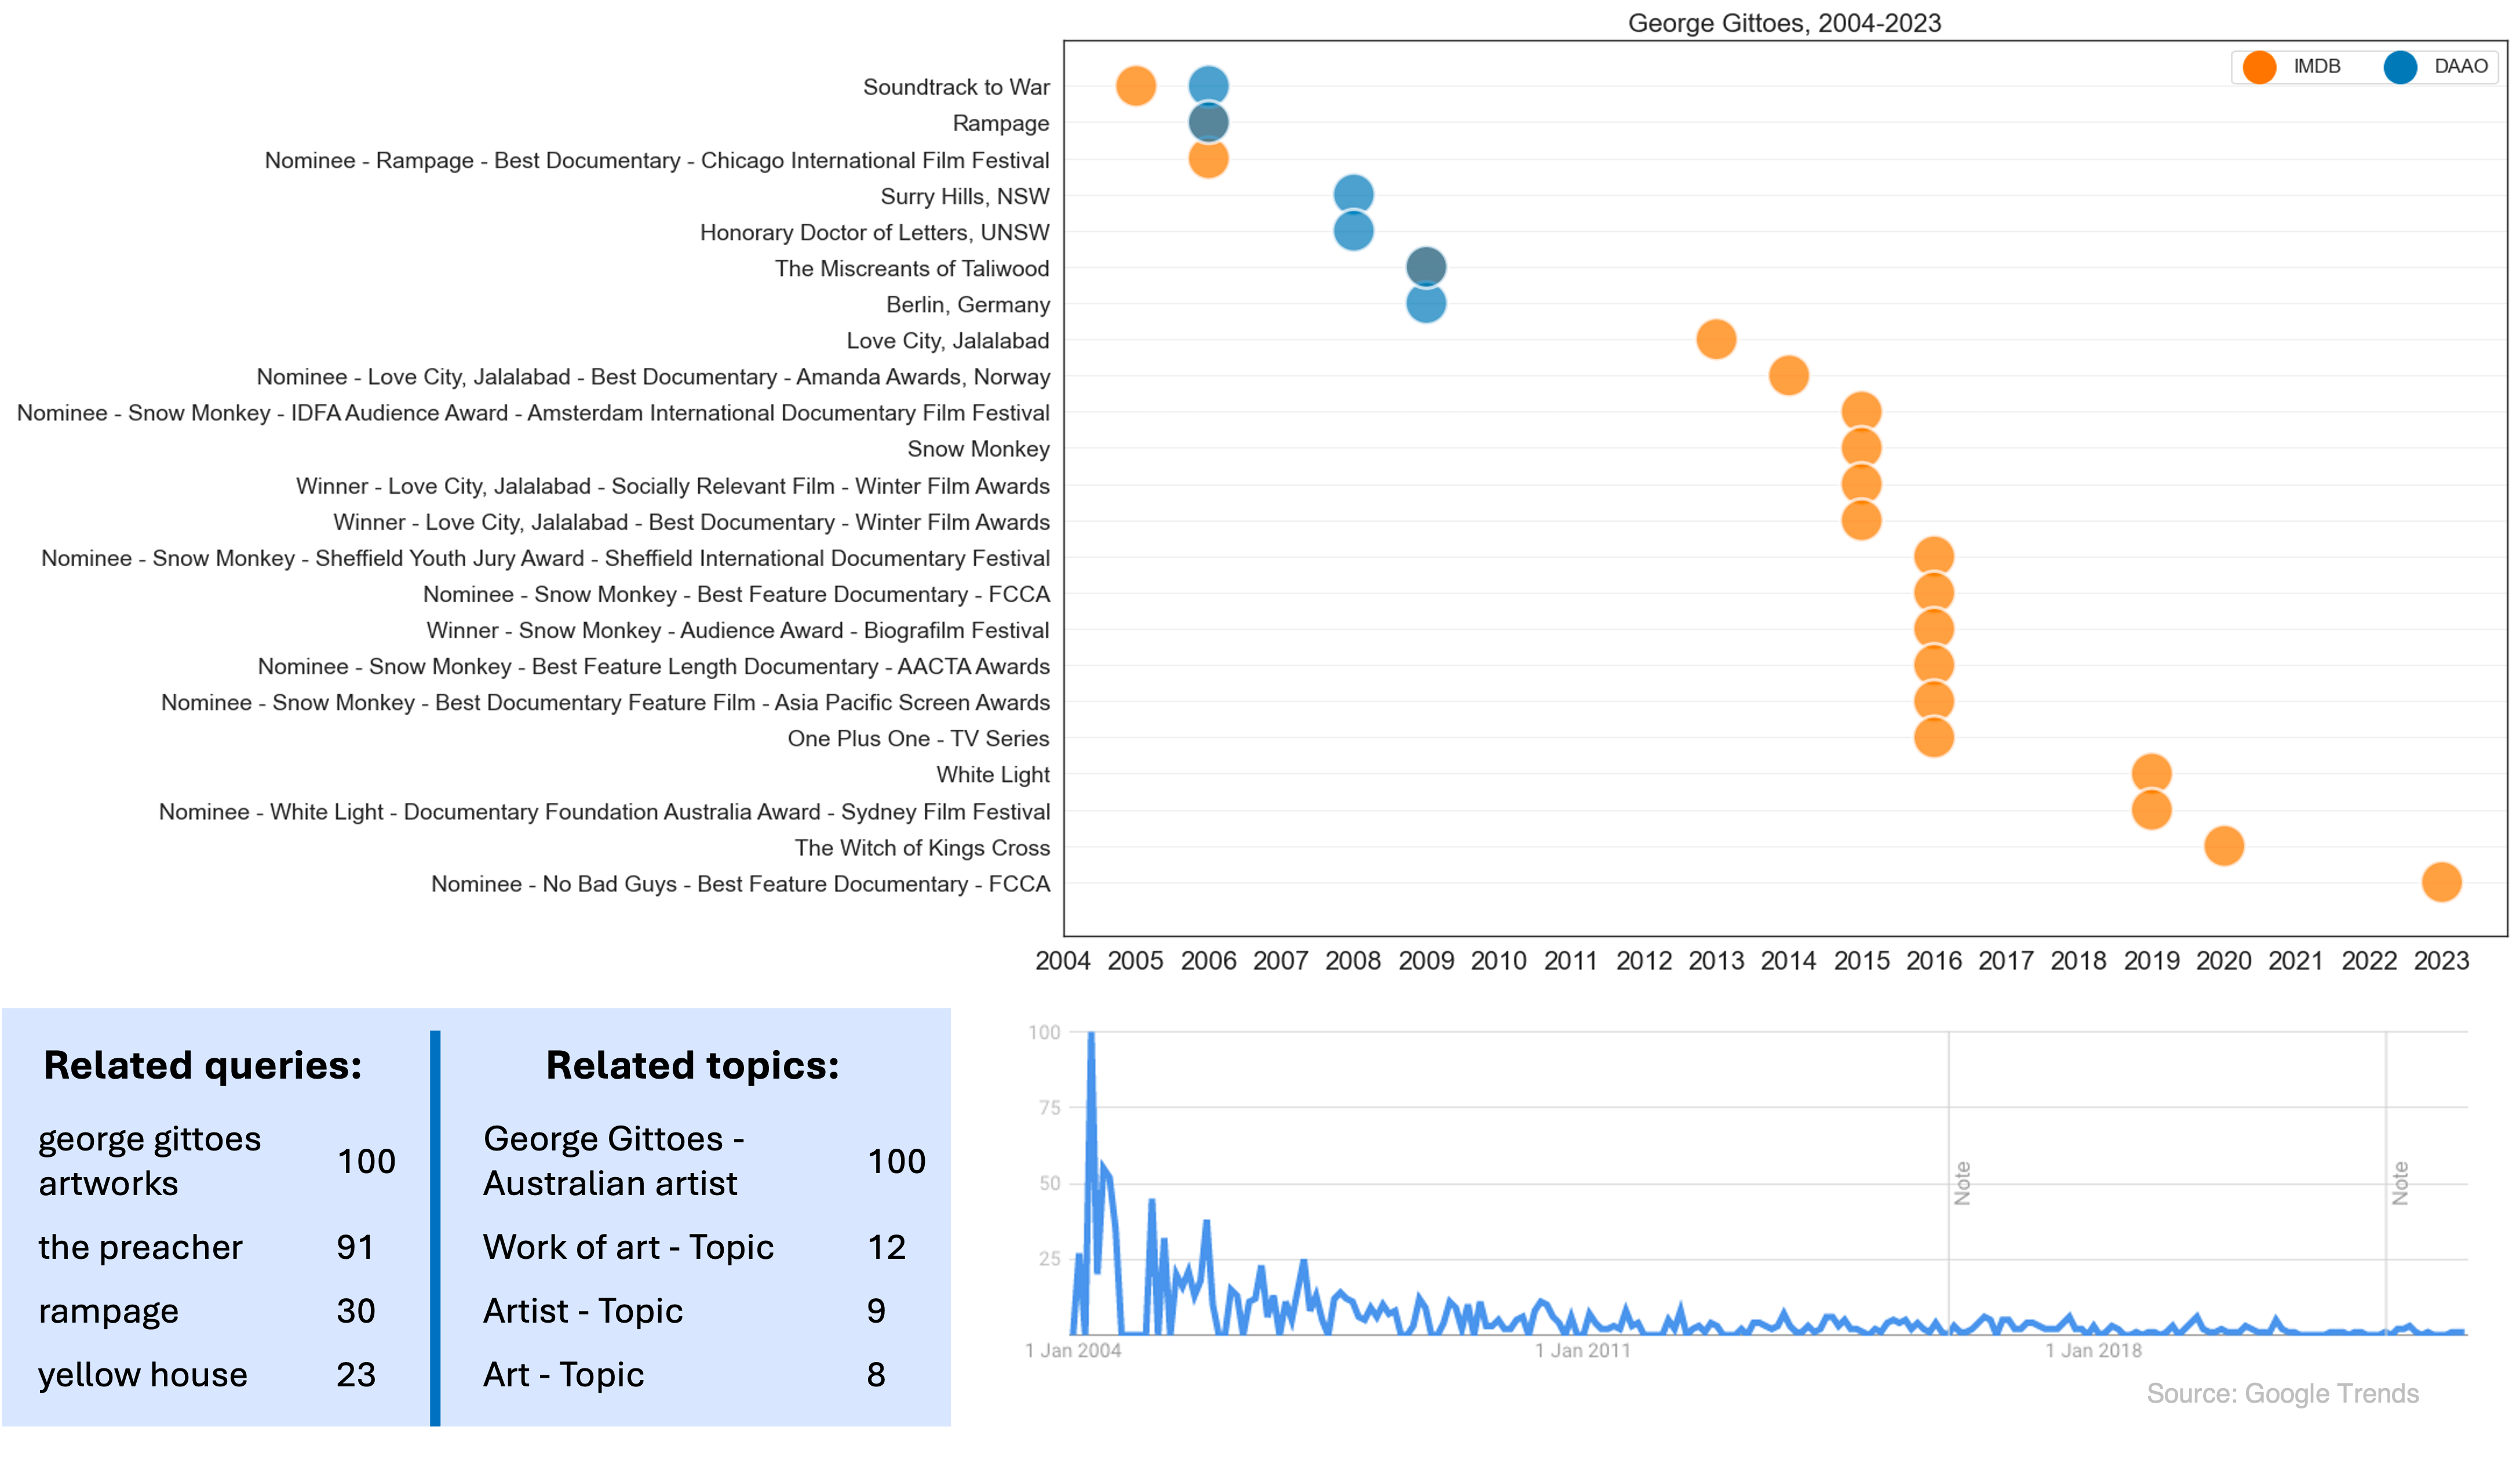
We also compare recent events found across these datasets with Google trends data. The Google trends data shows the number of searches for George Gittoes over time dating back to 2004. The data shows that the peak of searches for George Gittoes was in 2004, which coincides with the release of his documentary Soundtrack to War.
Show code cell source
# fig, ax = plt.subplots(figsize=(16,10))
# sns.scatterplot(data=george_df[george_df['Start'] >= 2004].sort_values('Start'),
# x='Start', y='Event',
# hue='Dataset', ax=ax, s=700, alpha=0.7, palette=['tab:orange','tab:blue','tab:orange'])

# plt.legend(loc='lower left', fontsize=14, ncol=2, facecolor='white')
# # for i in range(6): plt.gca().get_legend().legendHandles[i]._sizes = [200]

# # make y-axis labels larger
# plt.yticks(fontsize=14); plt.xticks(fontsize=16)
# plt.ylabel(''); plt.xlabel('')

# # add y-axis grid
# plt.grid(axis='y', alpha=0.3)

# # add a title
# plt.title('George Gittoes, 2004-2023' , fontsize=16)

# # # add annotation top right of plot to denote the vertical lines
# # plt.annotate('| = annual break', xy=(2006.5, -.5), fontsize=12, alpha=0.5)

# # move legend to specific location
# plt.legend(loc='upper right', fontsize=12, ncol=2, facecolor='white')
# for i in range(2): plt.gca().get_legend().legendHandles[i]._sizes = [400]

# # show each year on x-acis
# plt.xticks(np.arange(2004, 2024, 1))

# # increase y-axis limits to make room for the title
# plt.ylim(23.5, -1.25)

# plt.show()

Image(filename='images/images_analysis/ExternalDatasets_George_Trends.png')
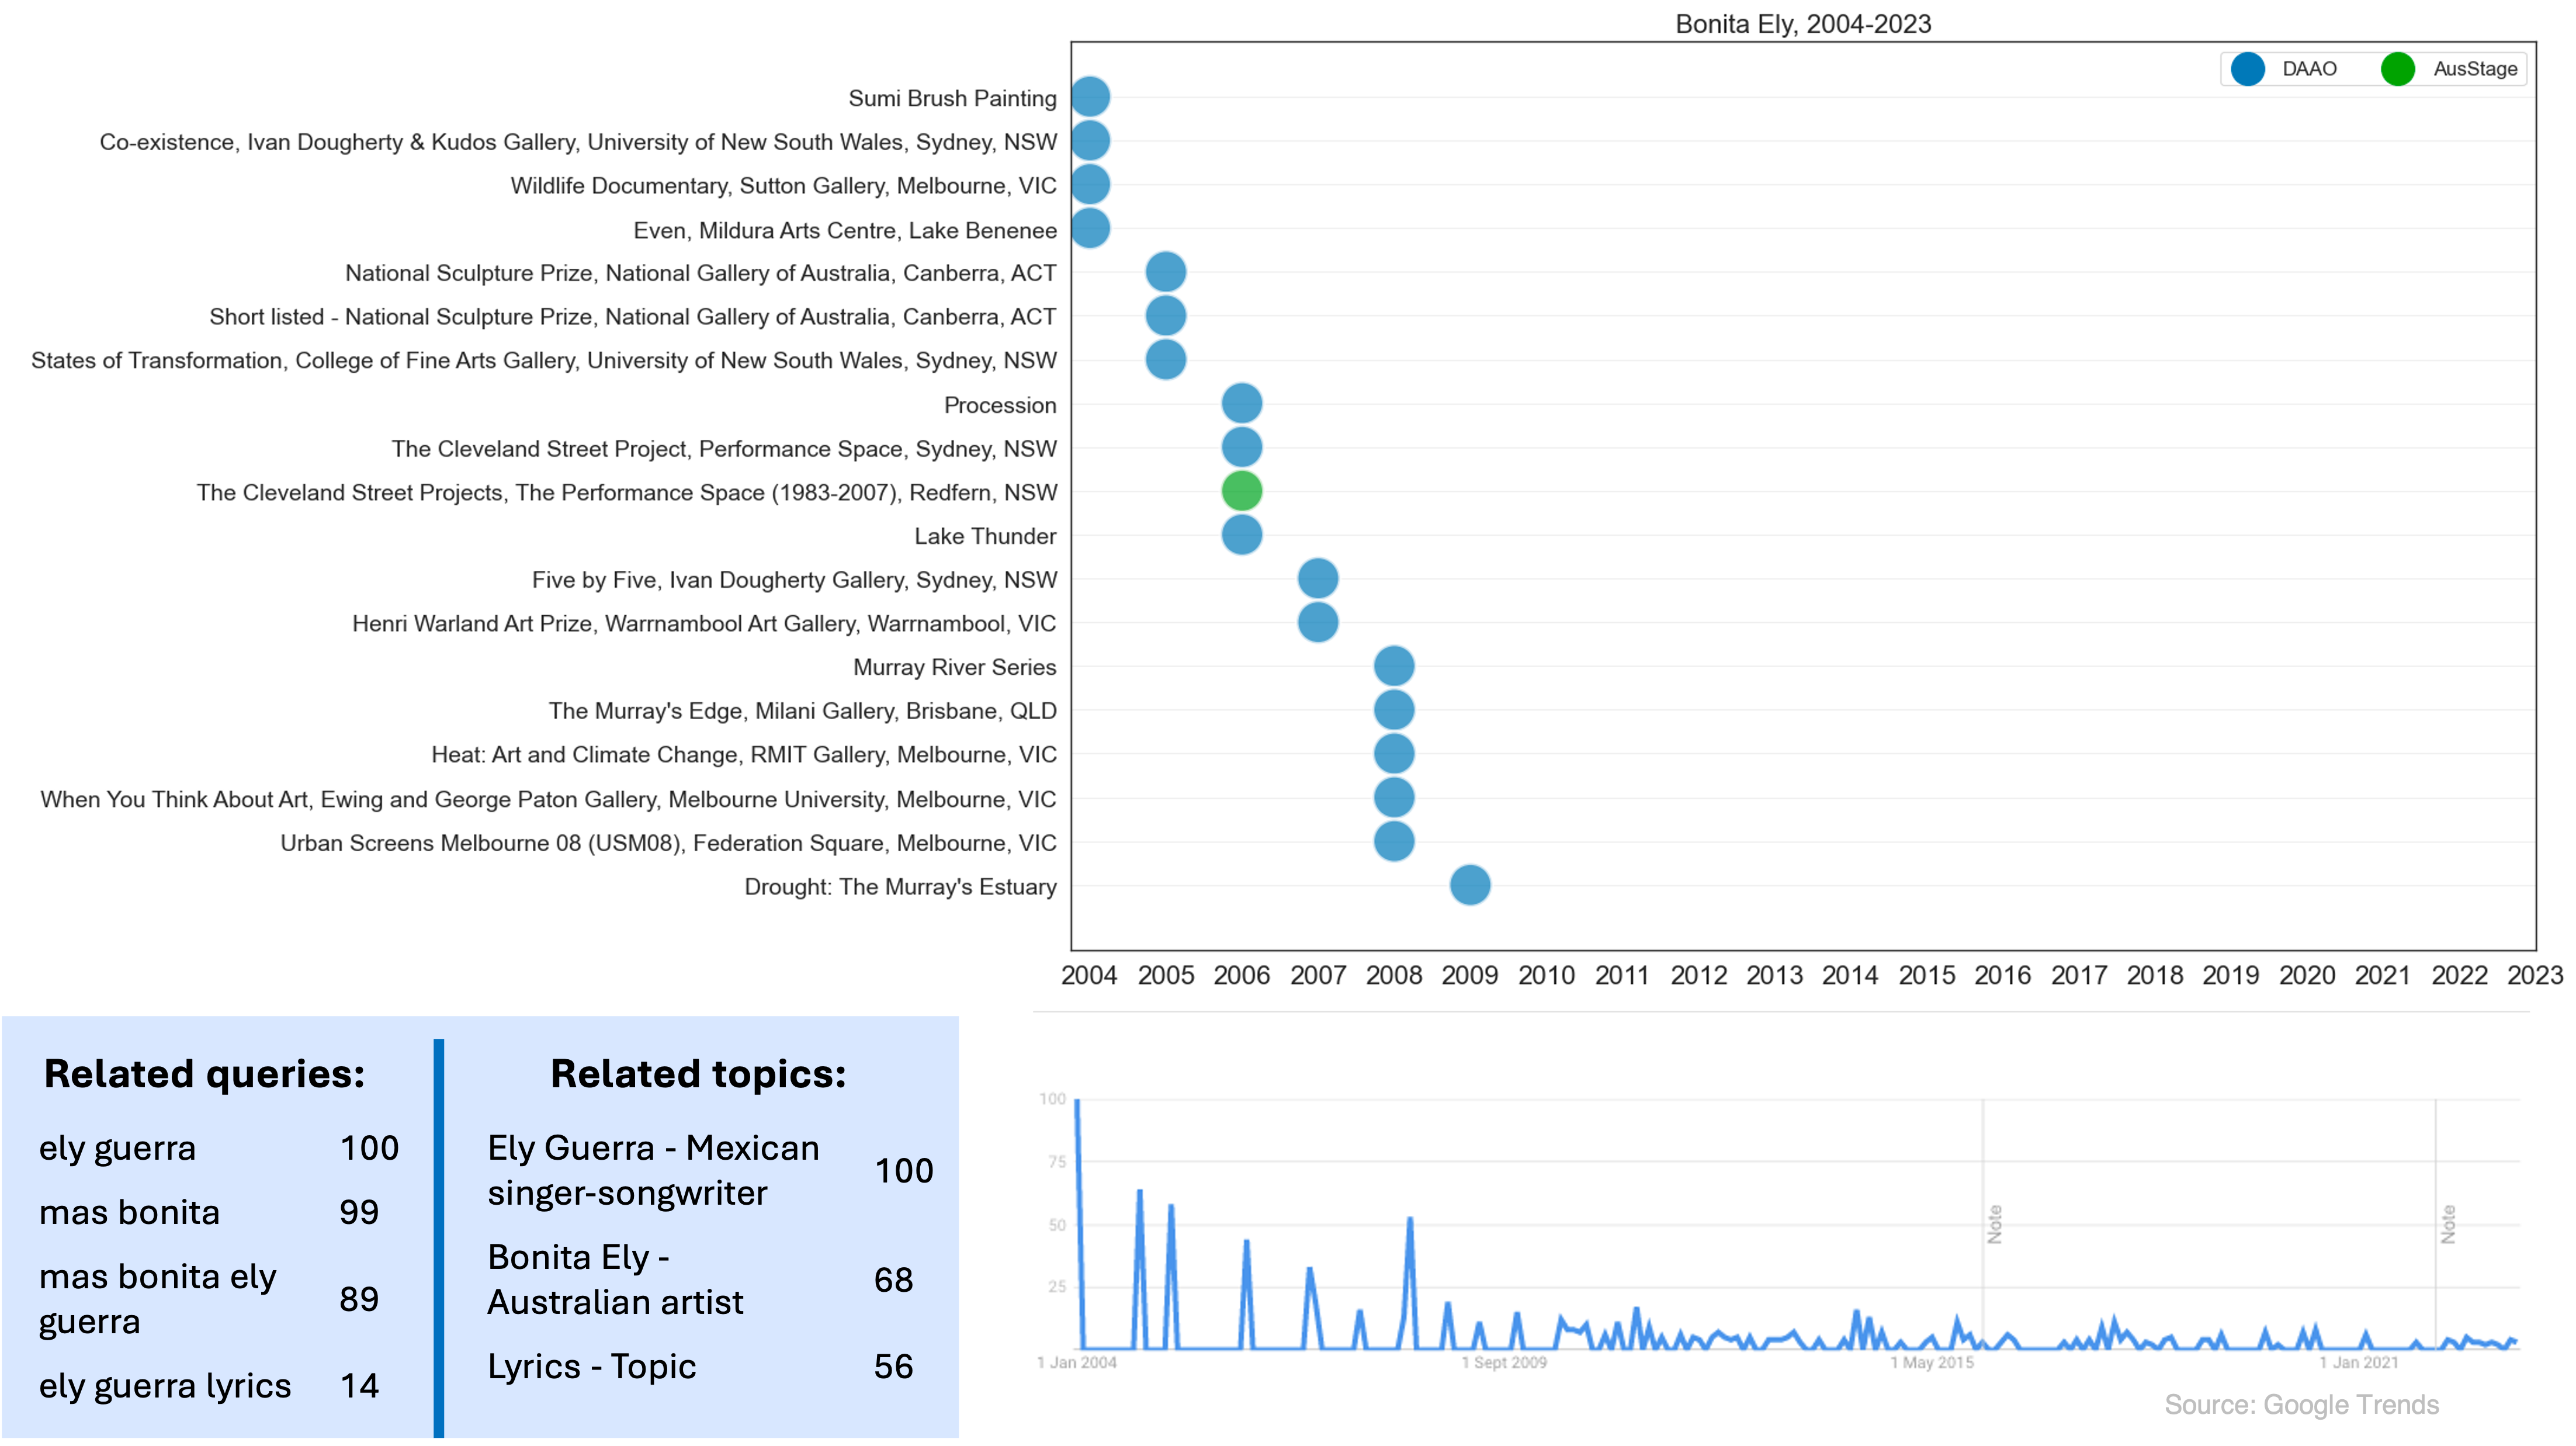
2. Bonita Ely#
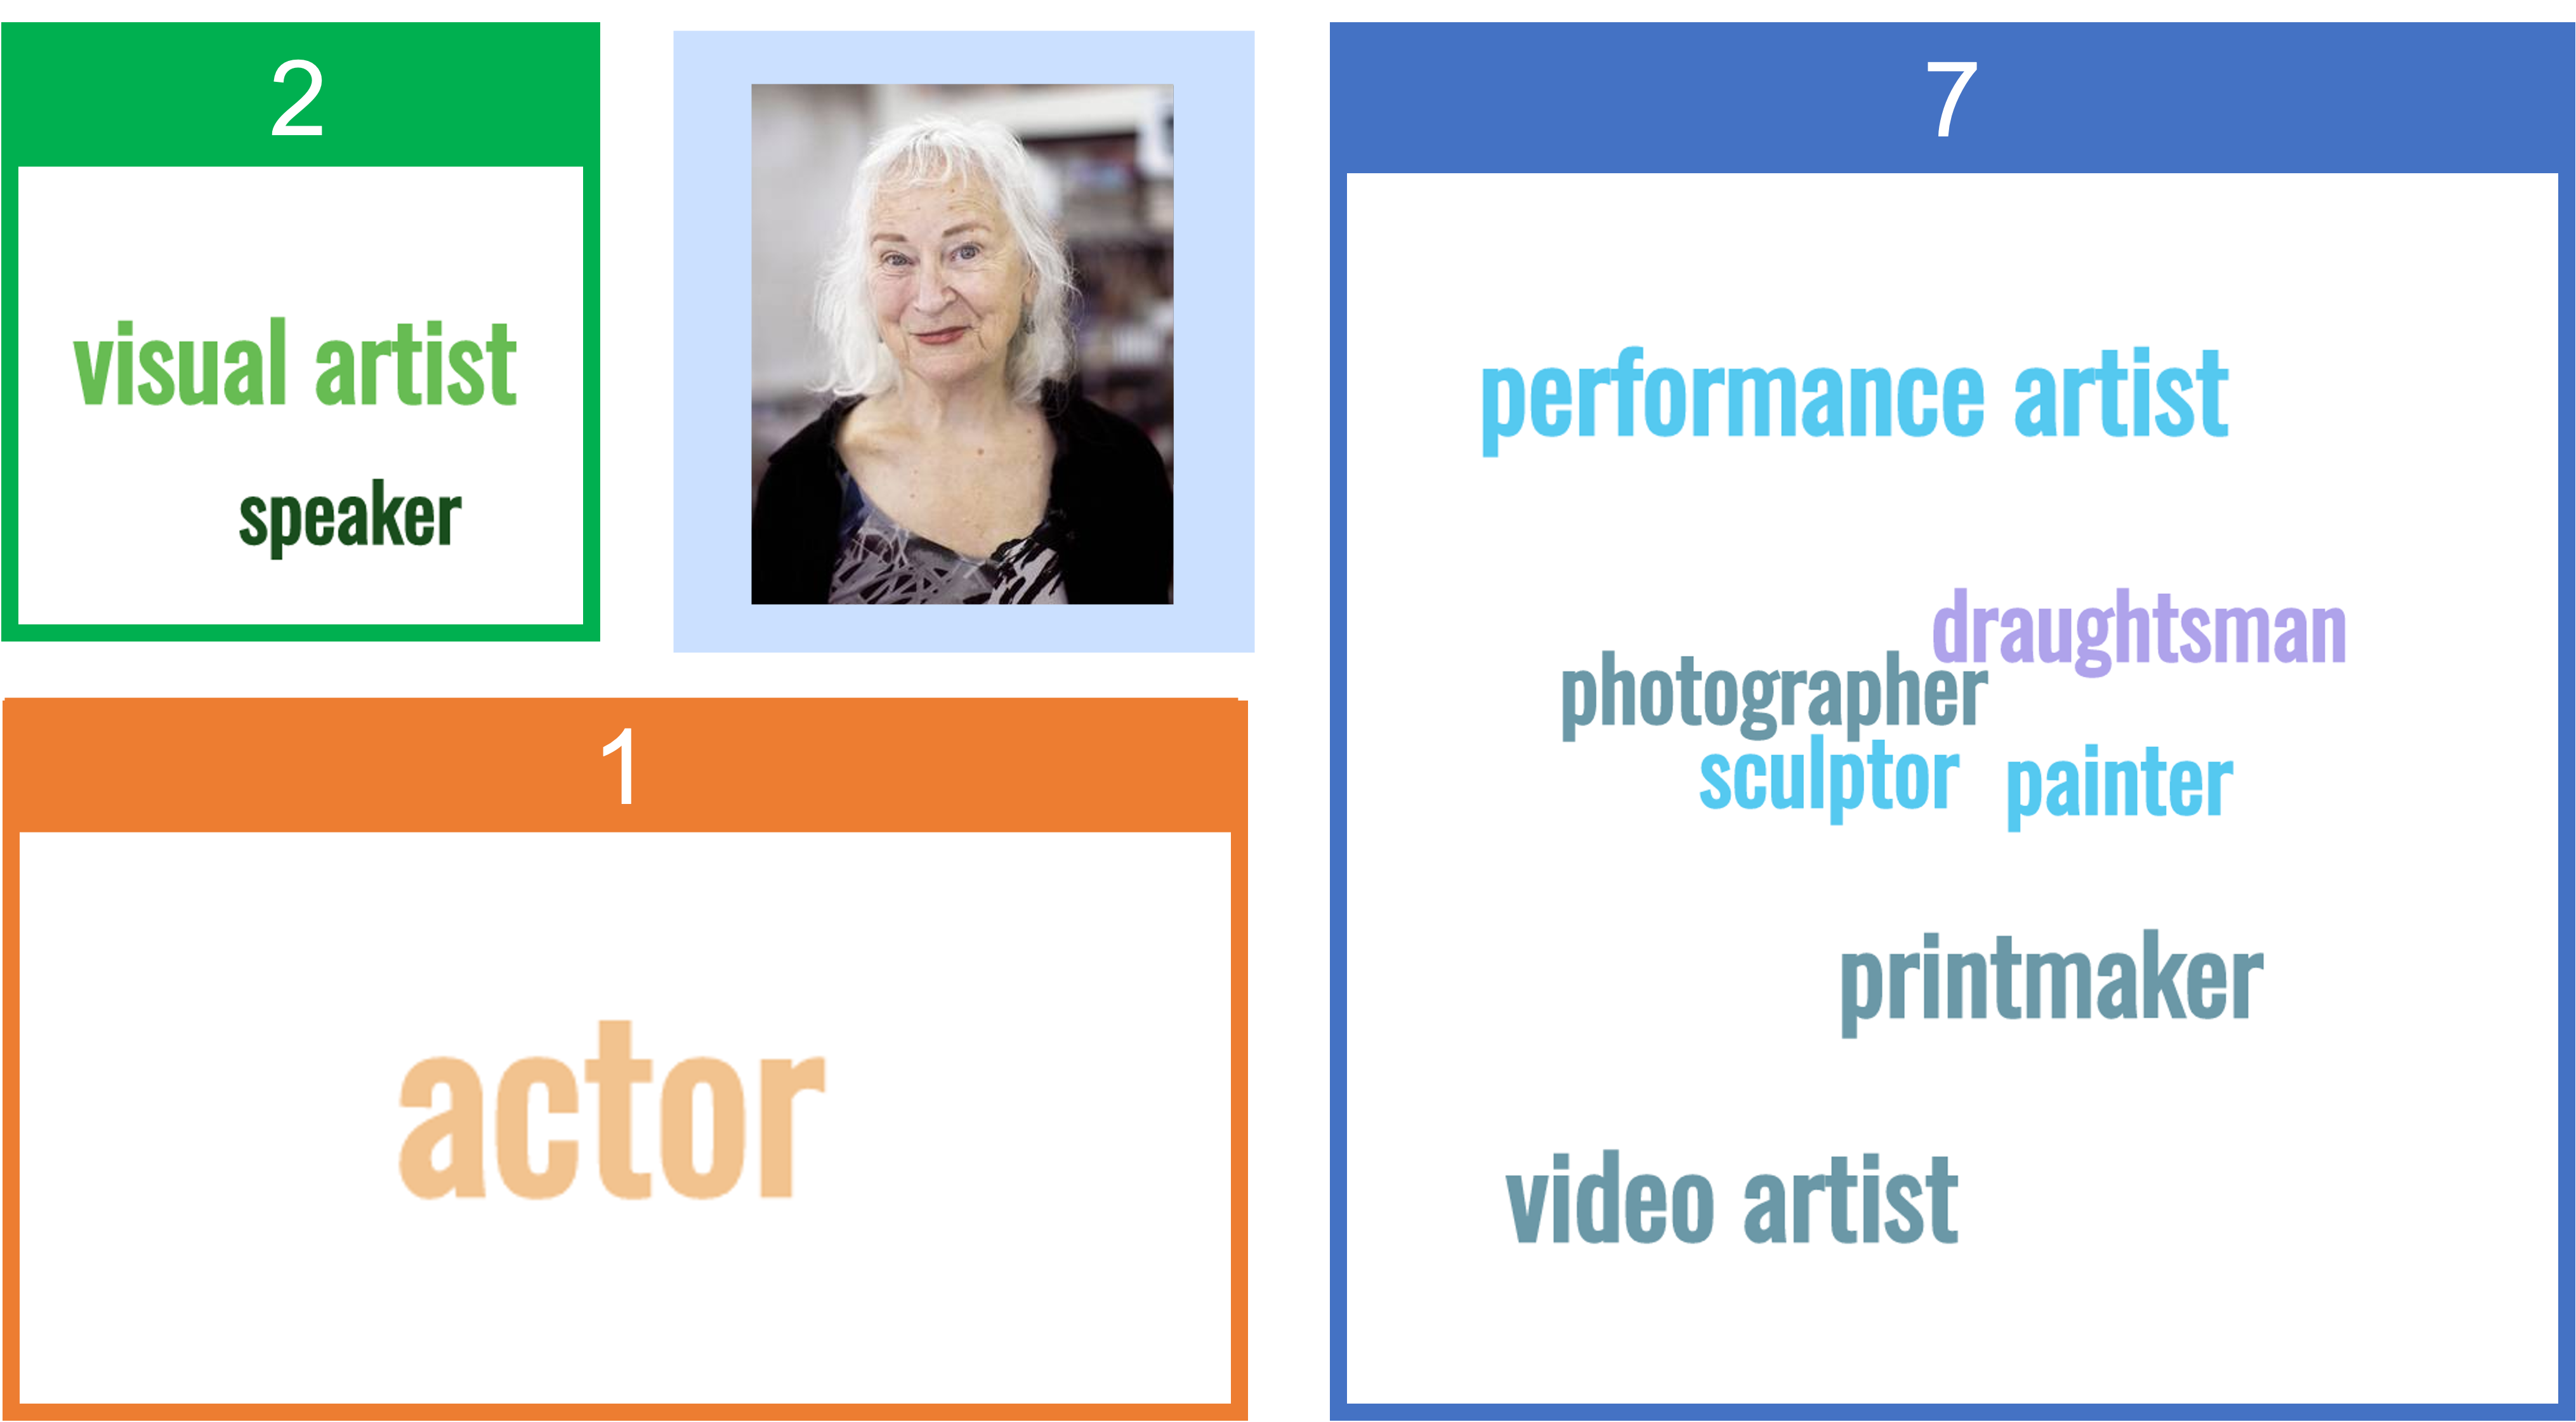
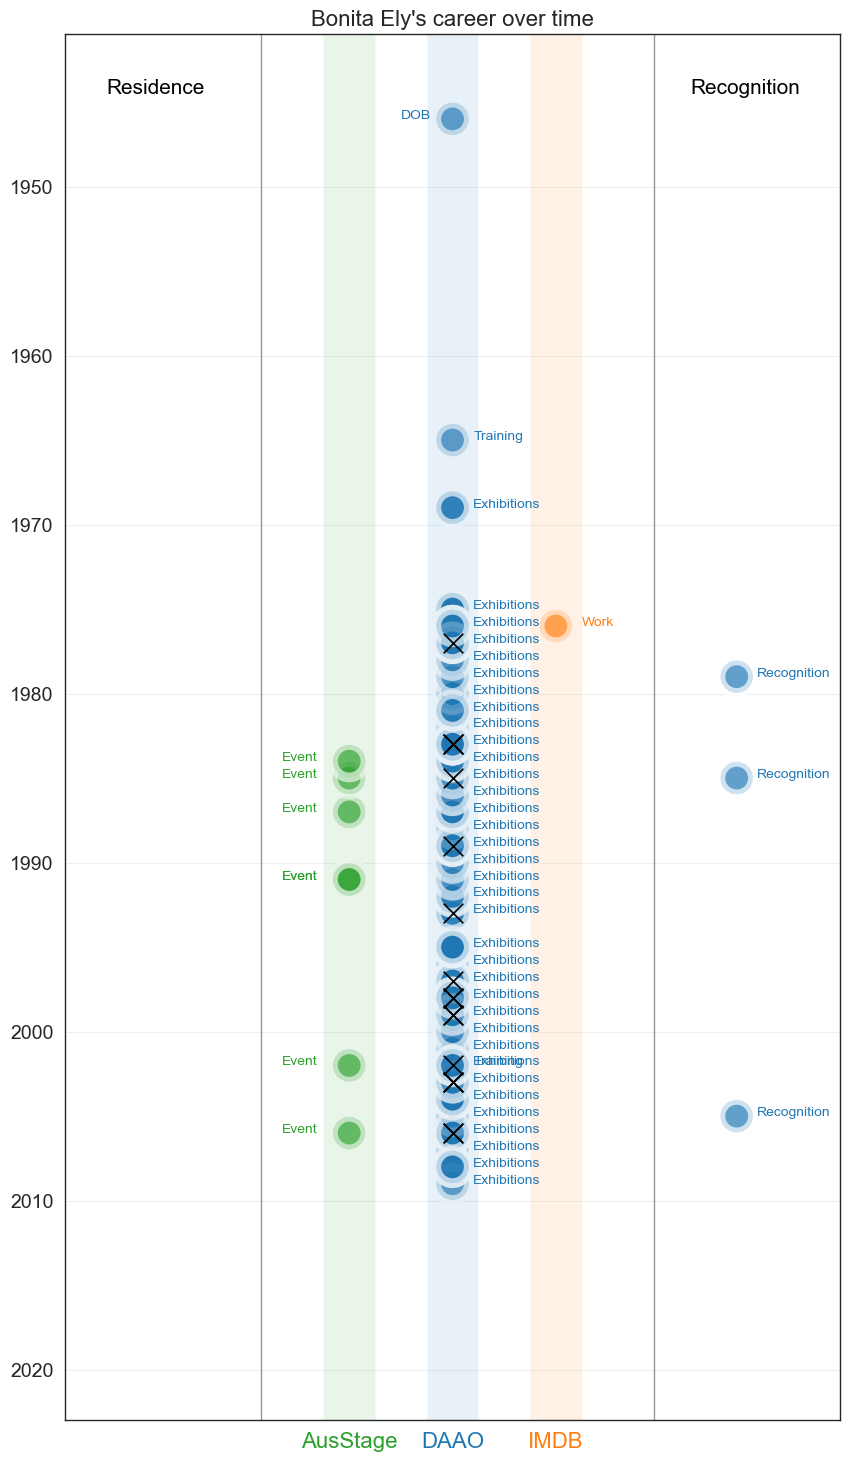
Bonita Ely established her reputation as an environmental artist in the early 1970s through her work on the Murray Darling rivers. She has a diverse practice across various media and has often addressed feminist, environmental and socio-political issues.
In the visual below, we show the number of roles recorded in AusStage (2), DAAO (7) and IMDb (1) for Bonita Ely.
Show code cell source
Image(filename='images/images_analysis/ExternalDatasets_bonita_ely.png')
Bonita’s trajectory differs quite a bit to George’s recorded trajectory. A majority of the events recorded are from the DAAO in relation to exhibtions. In IMDb, Bonita Ely appears as an actor for one short film, Faces (1976).
Show code cell source
george_df = four_case_studies_df[four_case_studies_df.Person == 'Bonita Ely']
g1 = george_df.copy()

ausstage = george_df[george_df.Dataset == 'AusStage'].reset_index(drop=True)
daao = george_df[george_df.Dataset == 'DAAO'].reset_index(drop=True)
imdb = george_df[george_df.Dataset == 'IMDB'].reset_index(drop=True)

g1 = g1[g1.Type != 'Residence']
g1_awards = g1[(g1.Type == 'Recognition') | (g1.Type == 'Winner') | (g1.Type == 'Nominee')]
g1 = g1[g1.Type != 'Winner']
g1 = g1[g1.Type != 'Nominee']
g1 = g1[g1.Type != 'Recognition']

fig, ax = plt.subplots(figsize=(10,18))
sns.scatterplot(data=g1.sort_values(['Dataset'], ascending=[True]),
x='Dataset', y='Start', hue='Dataset', ax=ax, s=550, alpha=0.7, linewidth=7,
palette=['tab:green','tab:blue','tab:orange'], legend=False)

plt.scatter(data=g1[(g1.Country != 'Australia') & (~g1.Country.isnull())].sort_values(['Dataset'], ascending=[True]),
            x='Dataset',y='Start', marker='x', color='black', s=200, zorder=10)

# change x-axis labels to be different colors
for label in ax.get_xticklabels():
    dataset_label = label.get_text()
    if dataset_label == 'AusStage': label.set_color('tab:green')
    elif dataset_label == 'DAAO': label.set_color('tab:blue')
    elif dataset_label == 'IMDB': label.set_color('tab:orange')

sns.scatterplot(data=g1_awards[g1_awards.Type != 'Recognition'].sort_values(['Dataset'], ascending=[True]),
x=3.75, y='Start', hue='Dataset', ax=ax, s=550, alpha=0.7, palette=['tab:orange'], legend=True,linewidth=7)

sns.scatterplot(data=g1_awards[g1_awards.Type == 'Recognition'].sort_values(['Dataset'], ascending=[True]),
x=3.75, y='Start', hue='Dataset', ax=ax, s=550, alpha=0.7, palette=['tab:blue'], legend=True, linewidth=7)

plt.legend(loc='lower left', fontsize=14, ncol=2, facecolor='white')
# for i in range(6): plt.gca().get_legend().legendHandles[i]._sizes = [200]

# make y-axis labels larger
plt.yticks(fontsize=14); plt.xticks(fontsize=16)
plt.ylabel(''); plt.xlabel('')

# add y-axis grid
plt.grid(axis='y', alpha=0.3)

# add a title
plt.title("Bonita Ely's career over time" , fontsize=16)

# add higlighted rectangles centered at 0
plt.axvspan(-0.25, 0.25, facecolor='tab:green', alpha=0.1)
plt.axvspan(0.75, 1.25, facecolor='tab:blue', alpha=0.1)
plt.axvspan(1.75, 2.25, facecolor='tab:orange', alpha=0.1)


# add vertical line
# add a horizontal line  between the start and end of each person's career
for idx,p in enumerate(daao[daao['Type'] == 'Residence'].sort_values('Start')['Event'].unique()):
    start = daao[(daao['Event']==p)]['Start'].min()
    end = daao[(daao['Event']==p)]['End'].max()
    if (start==end) | (start+1==end):

        sns.scatterplot(data=daao[daao['Event']==p].sort_values(['Start'], ascending=[True]),
        x=-2.2, y='Start',hue='Event', ax=ax, s=550, alpha=0.15, palette=['tab:blue'], legend=False)

        plt.scatter(data=daao[(daao['Event']==p) & (daao.Country != 'Australia') & (~daao.Country.isnull())].sort_values(['Start'], ascending=[True]),
            x=-2.2,y=2009, marker='x', color='black', s=200, zorder=10)

    else:
        if idx % 2 == 0: plt.plot([-2,-2], [start+0.4, end-0.4], linewidth=24, zorder=0, color = 'tab:blue', alpha=0.4)
        else: plt.plot([-2.2,-2.2], [start+0.4, end-0.4], linewidth=24, zorder=0, color = 'tab:blue', alpha=0.15)


# add annottation above the vertical line
plt.annotate('Residence', (-2.35, g1['Start'].min()-1.5), fontsize=15, alpha=1, color='black')


# add annottation above the vertical line
plt.annotate('Recognition', (3.3, g1['Start'].min()-1.5), fontsize=15, alpha=1, color='black')


# add text labels for each Residence event
for idx,p in enumerate(daao[daao['Type'] == 'Residence'].sort_values('Start')['Event'].unique()):
    start = daao[(daao['Event']==p)]['Start'].min()
    end = daao[(daao['Event']==p)]['End'].max()
    if (start==end) | (start+1==end):
        ax.annotate(p, (-2.3, start), fontsize=10, alpha=1, color='tab:blue')
    else:
        if idx % 2 == 0: ax.annotate(p, (-2.3, (start+end)/2), fontsize=10, alpha=1, color='tab:blue')
        else: ax.annotate(p, (-2.3, (start+end)/2), fontsize=10, alpha=1, color='tab:blue')

daao = daao[daao.Type != 'Residence']

for idx,x in enumerate(ausstage['Type']):
    y = ausstage[ausstage.Type.str.contains(x)]['Start'][idx]
    ax.annotate(x, (-.65, y), fontsize=10, alpha=1, color='tab:green')

for idx,x in enumerate(daao['Type'].unique()):
    y = george_df[(george_df.Dataset == 'DAAO') & (george_df.Type.str.contains(x))]['Start'].unique()
    for y in george_df[(george_df.Dataset == 'DAAO') & (george_df.Type.str.contains(x))]['Start'].unique():
        z = george_df[(george_df.Dataset == 'DAAO') & (george_df.Type.str.contains(x)) & (george_df.Start == y)]['Start'].iloc[0]
        if (x == 'Recognition'): ax.annotate(x, (3.95, z), fontsize=10, alpha=1, color='tab:blue')
        else:
            if idx % 2 == 0: ax.annotate(x, (0.5, z), fontsize=10, alpha=1, color='tab:blue')
            else: ax.annotate(x, (1.2, z), fontsize=10, alpha=1, color='tab:blue')

for idx,x in enumerate(imdb['Type'].unique()):
    y = george_df[(george_df.Dataset == 'IMDB') & (george_df.Type.str.contains(x))]['Start'].unique()
    for y in george_df[(george_df.Dataset == 'IMDB') & (george_df.Type.str.contains(x))]['Start'].unique():
        z = george_df[(george_df.Dataset == 'IMDB') & (george_df.Type.str.contains(x)) & (george_df.Start == y)]['Start'].iloc[0]
        if (x == 'Nominee'): ax.annotate(x, (3, z), fontsize=10, alpha=1, color='tab:orange')
        elif (x == 'Winner'): ax.annotate(x, (4, z), fontsize=10, alpha=1, color='tab:orange')
        else:
            ax.annotate(x, (2.25, z), fontsize=10, alpha=1, color='tab:orange')

plt.ylim(1941,2023)

# change the order of the y-axis
plt.gca().invert_yaxis()

# add more space between the x-axis ticks
plt.xticks(np.arange(0, 10, 1))

# move legend to specific location
# plt.legend(loc='upper right', fontsize=12, ncol=1, facecolor='white', bbox_to_anchor=(0.965, 0.97))
# for i in range(2): plt.gca().get_legend().legendHandles[i]._sizes = [200]

# remove the legend
plt.legend().remove()

# add vertical lines on 0,1,2
plt.axvline(x=-.85, color='black', alpha=0.4, linestyle='-', linewidth=1)
plt.axvline(x=2.95, color='black', alpha=0.4, linestyle='-', linewidth=1)
# plt.axvline(x=0, color='lightgrey', alpha=0.4, linestyle='-', linewidth=1)
# plt.axvline(x=1, color='lightgrey', alpha=0.4, linestyle='-', linewidth=1)
# plt.axvline(x=2, color='lightgrey', alpha=0.4, linestyle='-', linewidth=1)

# # add annotation top right of plot to denote the vertical lines
# plt.annotate('| = annual break', xy=(2006.5, -.5), fontsize=12, alpha=0.5)

#remove y-axis title
plt.ylabel('')

# increase y-axis limits to make room for the title
plt.xlim(-2.75, 4.75)
plt.show()
Show code cell source
# fig, ax = plt.subplots(figsize=(16,10))
# sns.scatterplot(data=george_df[george_df['Start'] >= 2004].sort_values('Start'),
# x='Start', y='Event',
# hue='Dataset', ax=ax, s=700, alpha=0.7, palette=['tab:blue','tab:green','tab:orange'])

# plt.legend(loc='lower left', fontsize=14, ncol=2, facecolor='white')
# # for i in range(6): plt.gca().get_legend().legendHandles[i]._sizes = [200]

# # make y-axis labels larger
# plt.yticks(fontsize=14); plt.xticks(fontsize=16)
# plt.ylabel(''); plt.xlabel('')

# # add y-axis grid
# plt.grid(axis='y', alpha=0.3)

# # add a title
# plt.title('Bonita Ely, 2004-2023' , fontsize=16)

# # # add annotation top right of plot to denote the vertical lines
# # plt.annotate('| = annual break', xy=(2006.5, -.5), fontsize=12, alpha=0.5)

# # move legend to specific location
# plt.legend(loc='upper right', fontsize=12, ncol=2, facecolor='white')
# for i in range(2): plt.gca().get_legend().legendHandles[i]._sizes = [400]

# # show each year on x-acis
# plt.xticks(np.arange(2004, 2024, 1))

# # increase y-axis limits to make room for the title
# plt.ylim(19.5, -1.25)

# plt.show()

Image(filename='images/images_analysis/ExternalDatasets_Bonita_Trends.png')
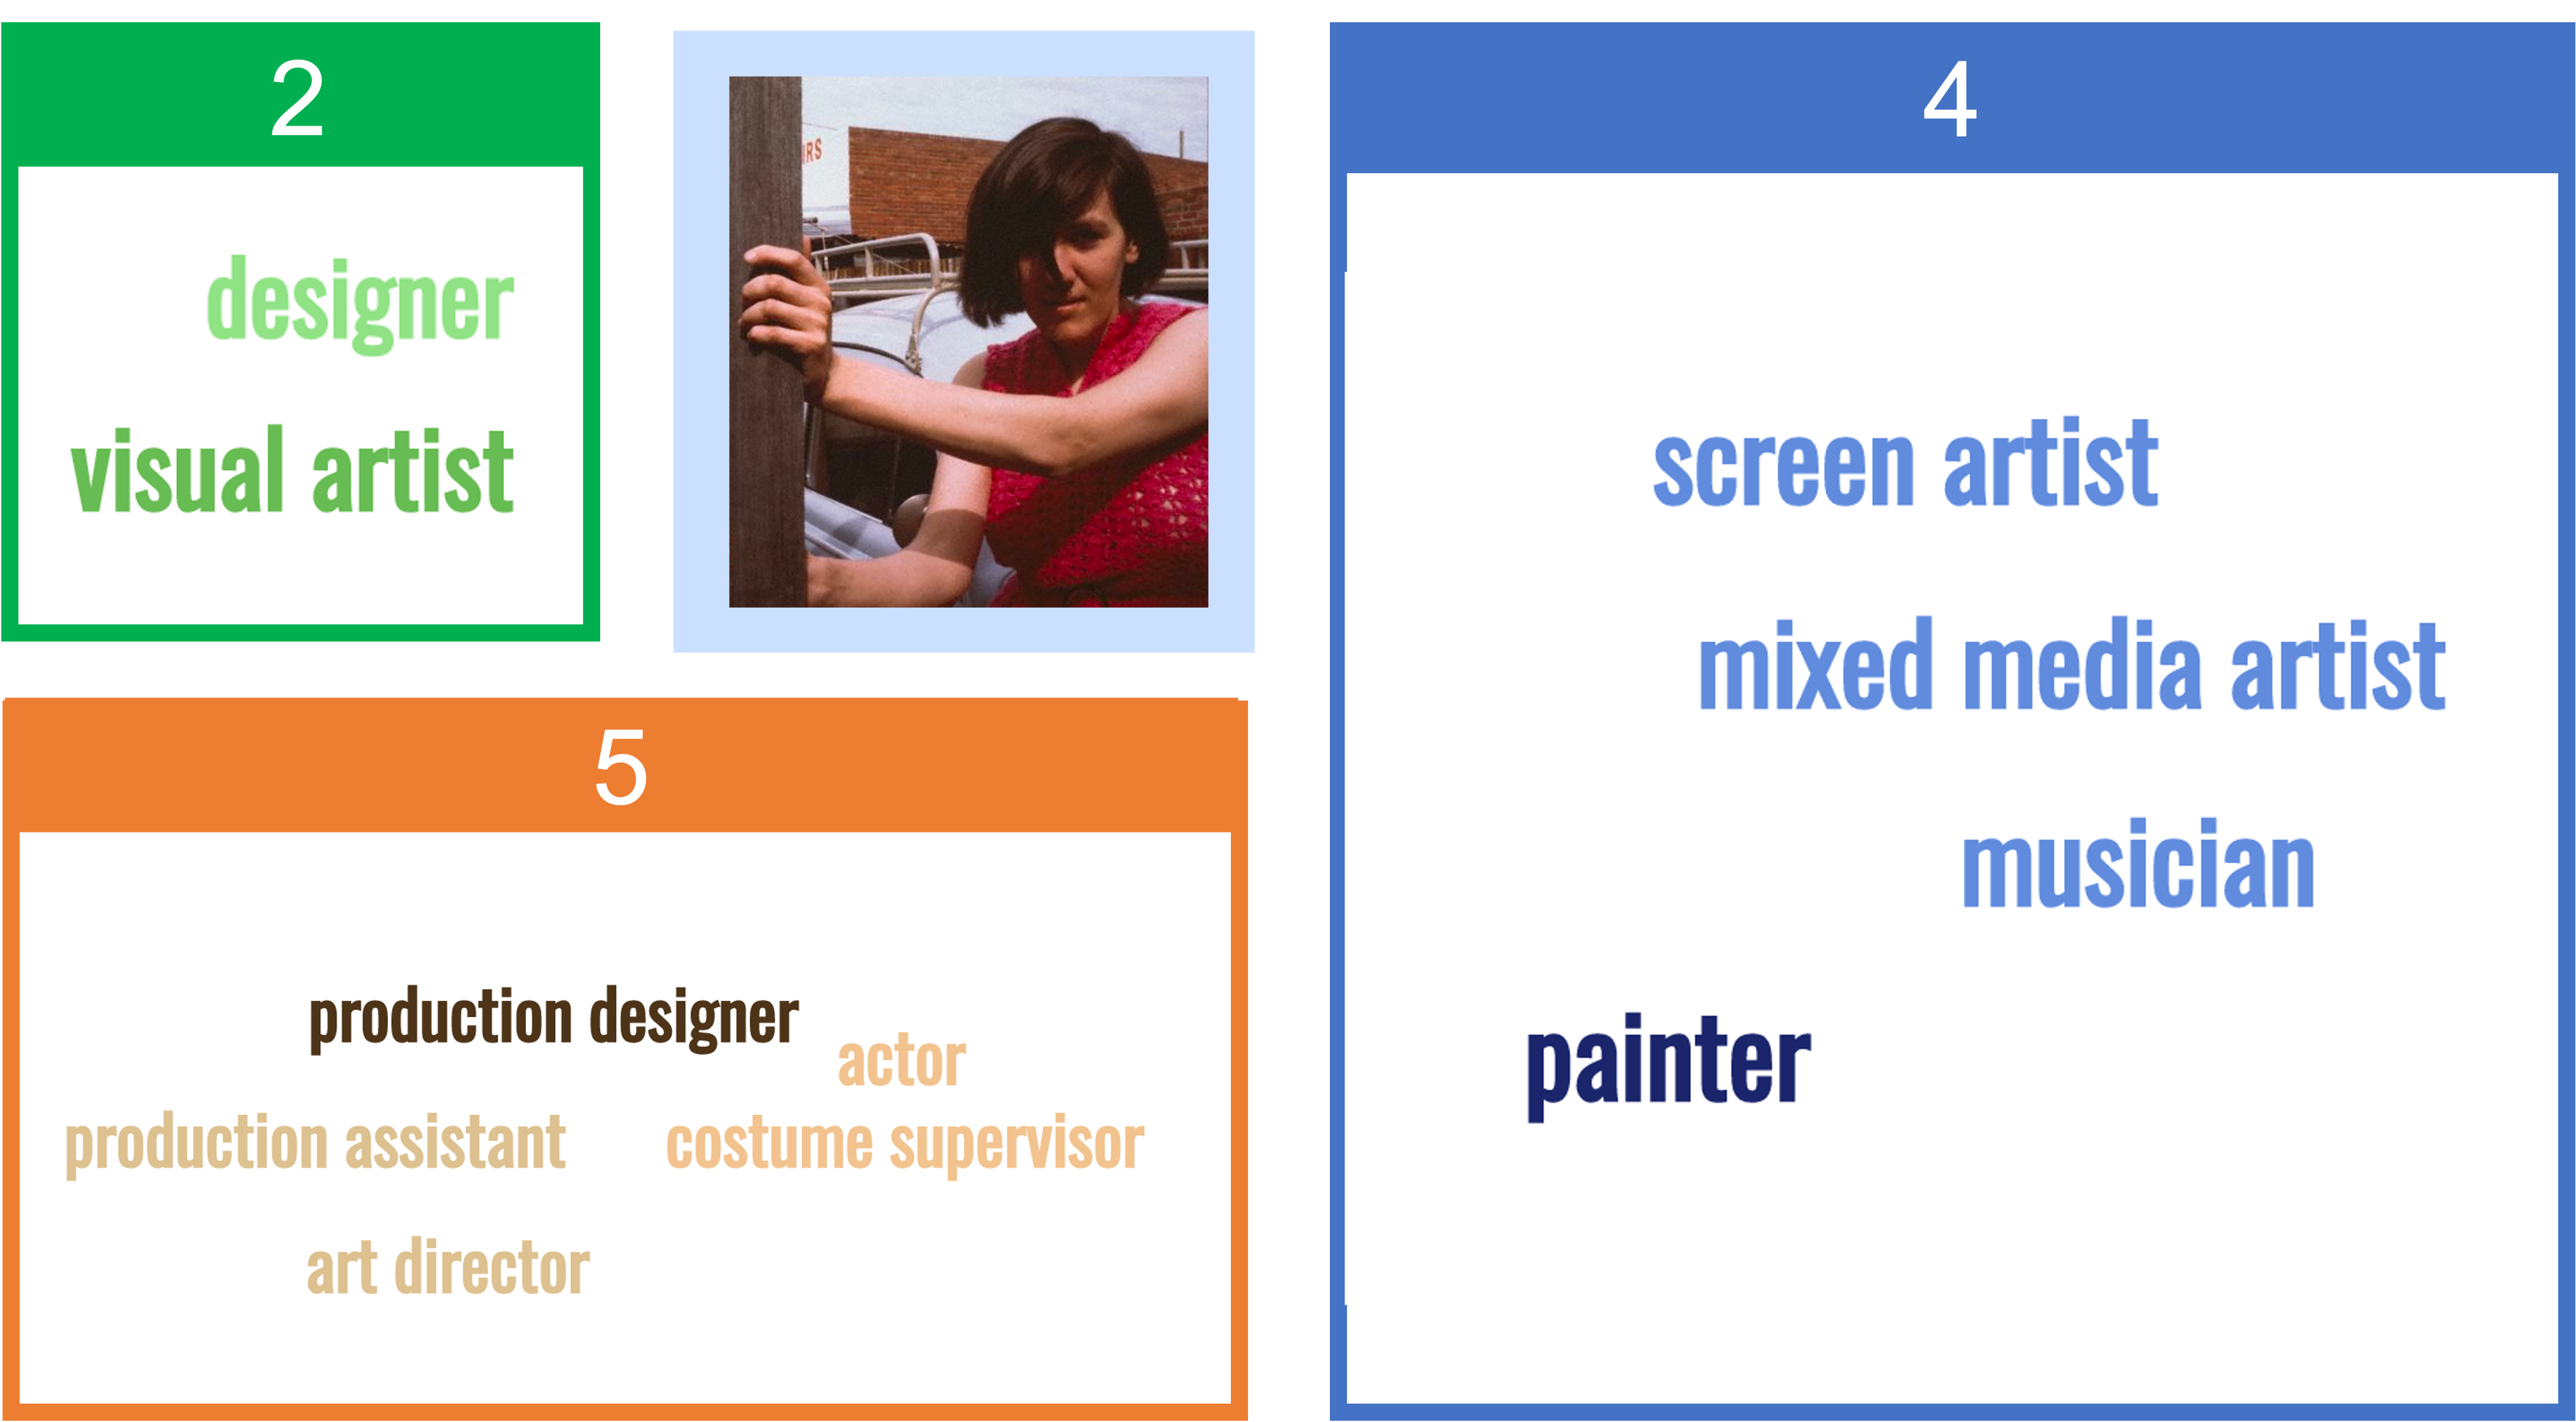
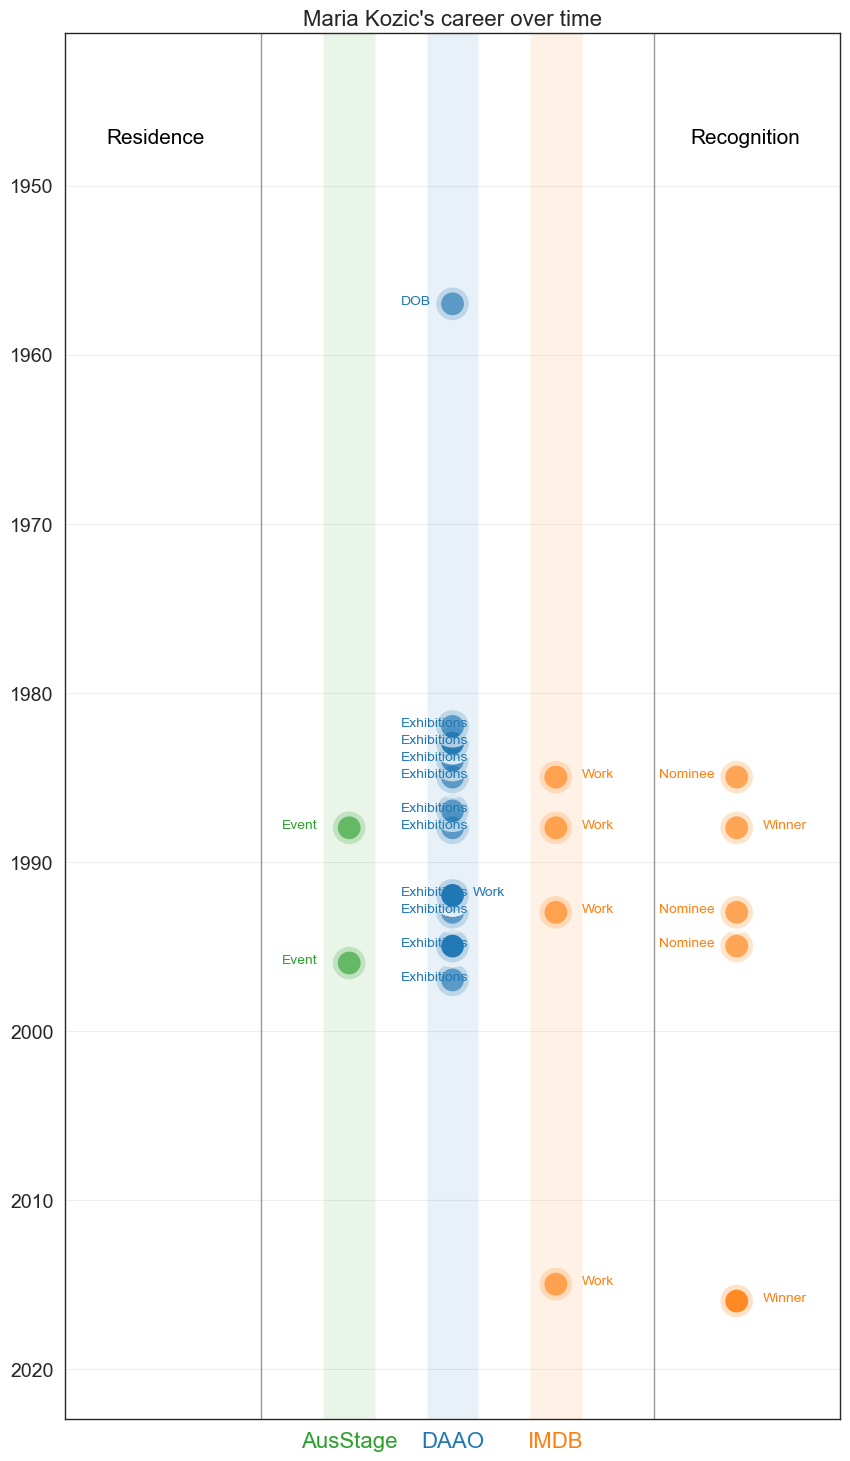
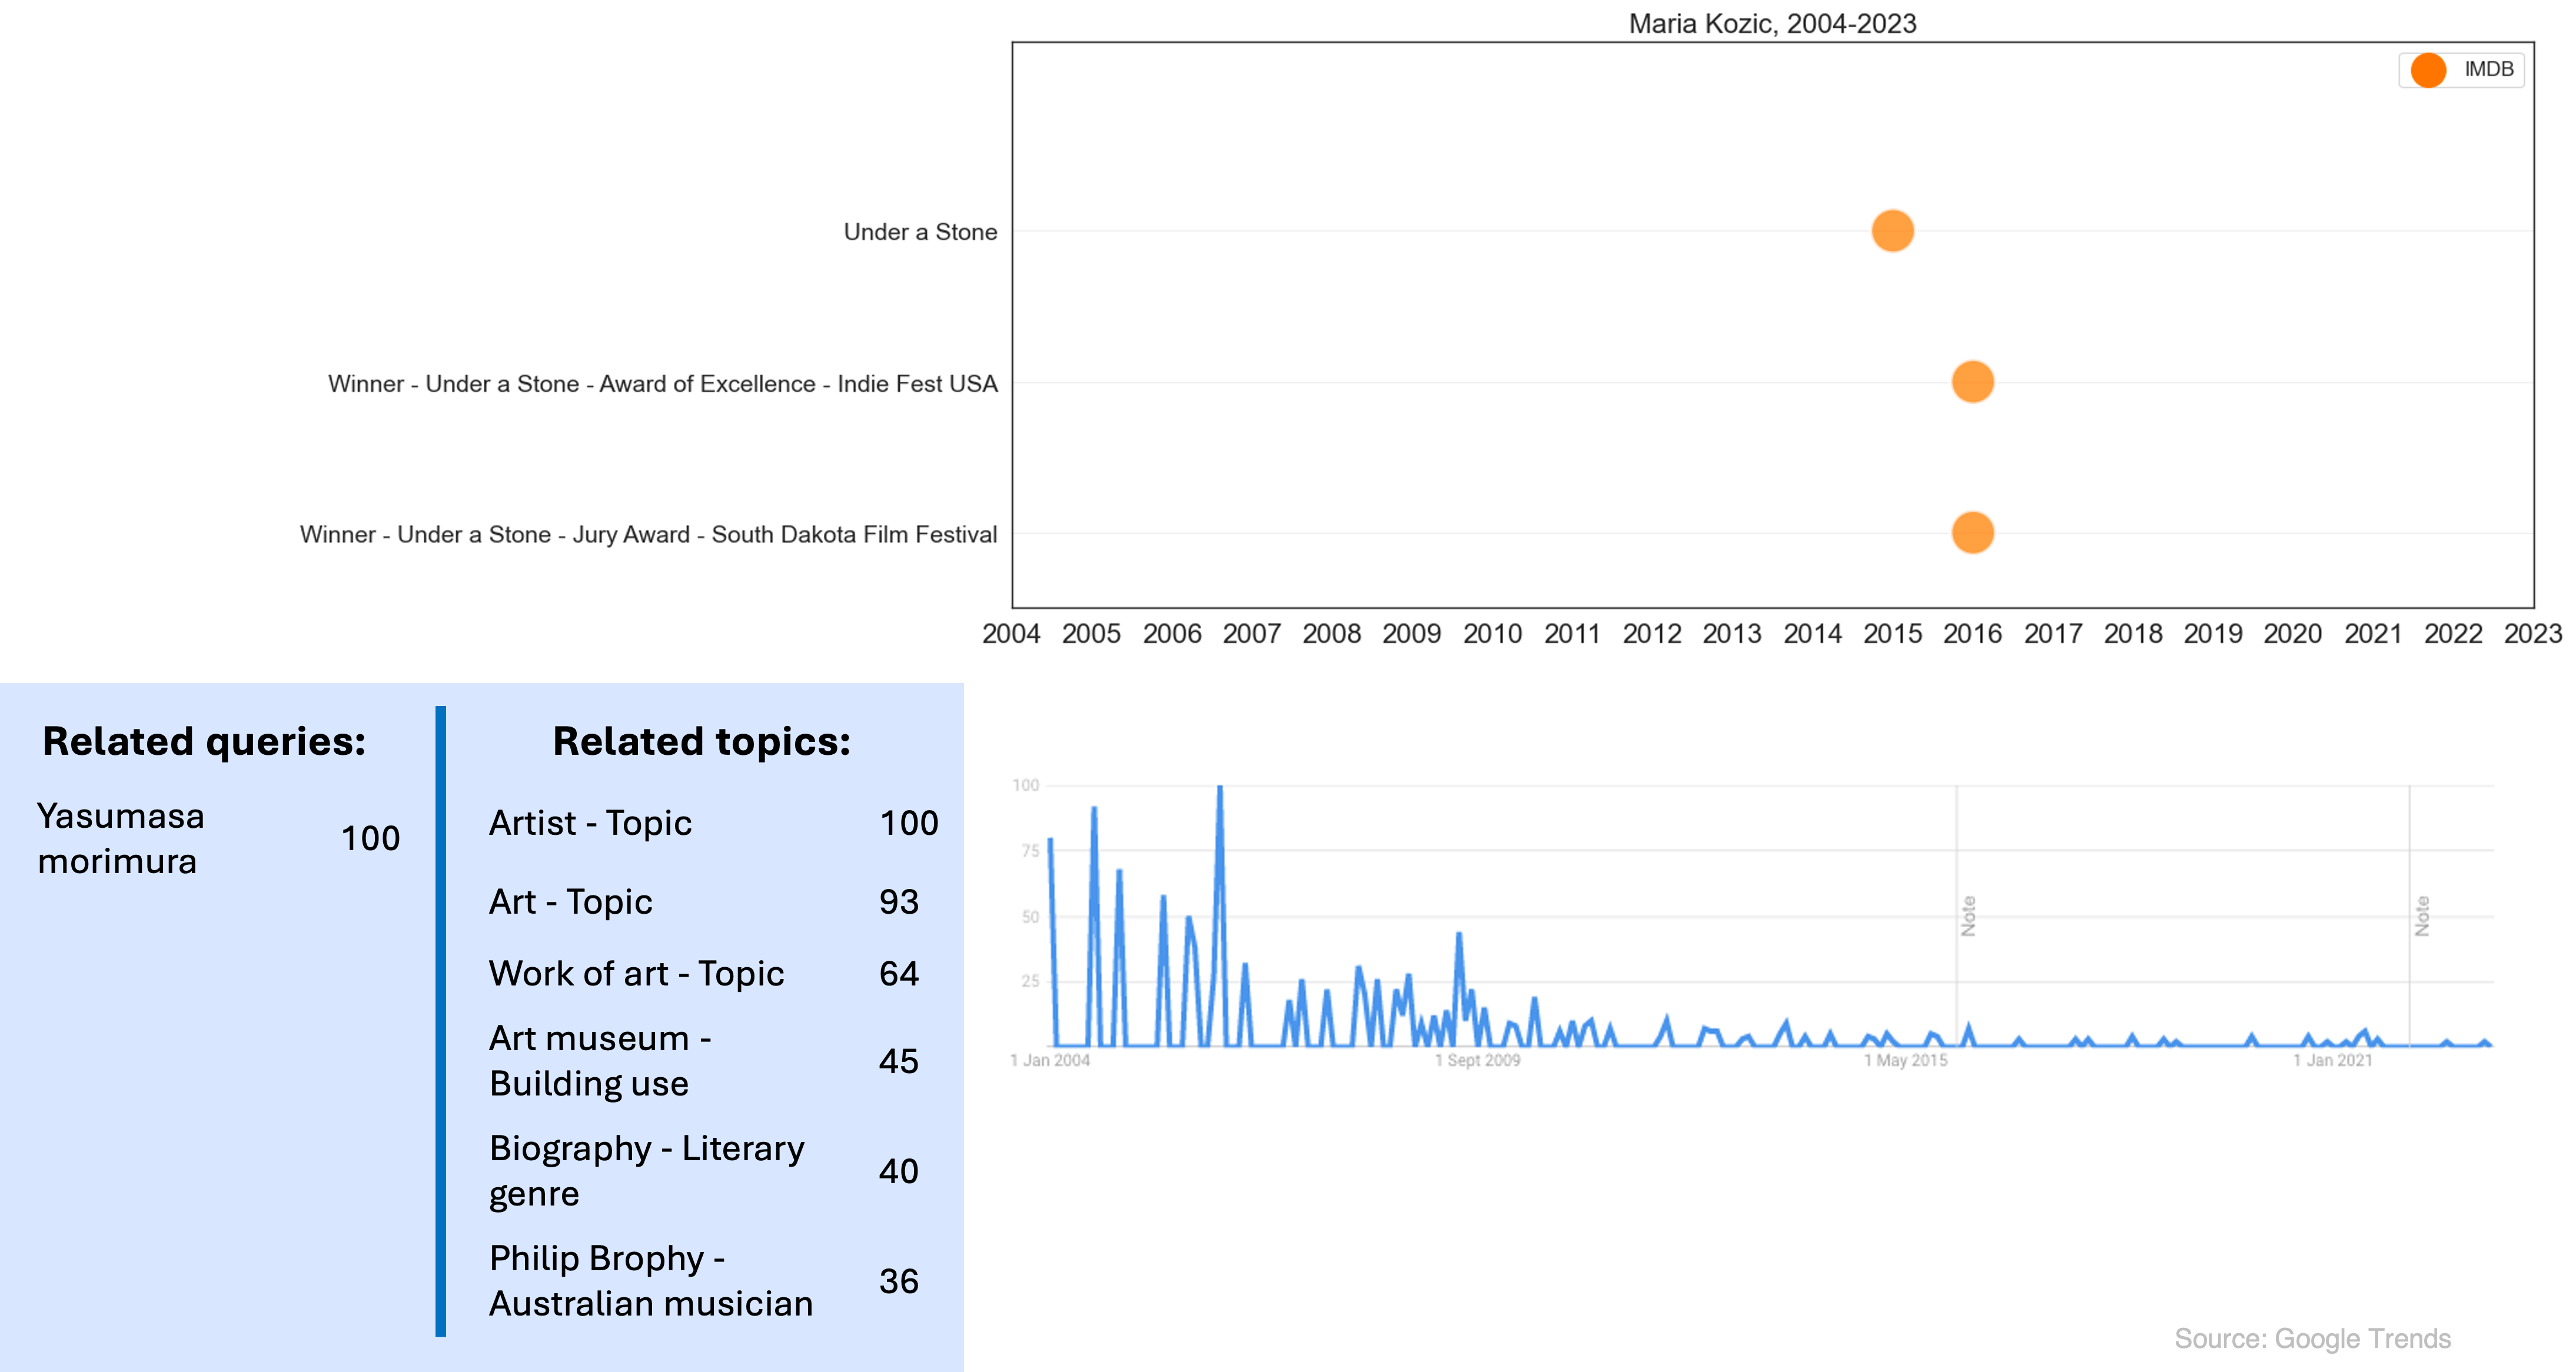
3. Maria Kozic#
Contemporary multi-media artist whose work often deals with gender issues and feminist politics. Her work includes the gigantic inflatable plastic ‘Blue Boy’ that topped Sydney’s MCA building in 1992 and her billboard ‘Maria Kozic is Bitch’.
In the visual below, we show the number of roles recorded in AusStage (2), DAAO (4) and IMDb (5) for Maria Kozic.
Show code cell source
Image(filename='images/images_analysis/ExternalDatasets_maria.png')
Maria’s recorded trajectory is concentrated between the early 80s and the late 90s.
Show code cell source
george_df = four_case_studies_df[four_case_studies_df.Person == 'Maria Kozic']
g1 = george_df.copy()

ausstage = george_df[george_df.Dataset == 'AusStage'].reset_index(drop=True)
daao = george_df[george_df.Dataset == 'DAAO'].reset_index(drop=True)
imdb = george_df[george_df.Dataset == 'IMDB'].reset_index(drop=True)

g1 = g1[g1.Type != 'Residence']
g1_awards = g1[(g1.Type == 'Recognition') | (g1.Type == 'Winner') | (g1.Type == 'Nominee')]
g1 = g1[g1.Type != 'Winner']
g1 = g1[g1.Type != 'Nominee']
g1 = g1[g1.Type != 'Recognition']

fig, ax = plt.subplots(figsize=(10,18))
sns.scatterplot(data=g1.sort_values(['Dataset'], ascending=[True]),
x='Dataset', y='Start', hue='Dataset', ax=ax, s=550, alpha=0.7, linewidth=7,
palette=['tab:green','tab:blue','tab:orange'], legend=False)

plt.scatter(data=g1[(g1.Country != 'Australia') & (~g1.Country.isnull())].sort_values(['Dataset'], ascending=[True]),
            x='Dataset',y='Start', marker='x', color='black', s=200, zorder=10)

# change x-axis labels to be different colors
for label in ax.get_xticklabels():
    dataset_label = label.get_text()
    if dataset_label == 'AusStage': label.set_color('tab:green')
    elif dataset_label == 'DAAO': label.set_color('tab:blue')
    elif dataset_label == 'IMDB': label.set_color('tab:orange')

sns.scatterplot(data=g1_awards[g1_awards.Type != 'Recognition'].sort_values(['Dataset'], ascending=[True]),
x=3.75, y='Start', hue='Dataset', ax=ax, s=550, alpha=0.7, palette=['tab:orange'], legend=True,linewidth=7)

sns.scatterplot(data=g1_awards[g1_awards.Type == 'Recognition'].sort_values(['Dataset'], ascending=[True]),
x=3.75, y='Start', hue='Dataset', ax=ax, s=550, alpha=0.7, palette=['tab:blue'], legend=True, linewidth=7)

plt.legend(loc='lower left', fontsize=14, ncol=2, facecolor='white')
# for i in range(6): plt.gca().get_legend().legendHandles[i]._sizes = [200]

# make y-axis labels larger
plt.yticks(fontsize=14); plt.xticks(fontsize=16)
plt.ylabel(''); plt.xlabel('')

# add y-axis grid
plt.grid(axis='y', alpha=0.3)

# add a title
plt.title("Maria Kozic's career over time" , fontsize=16)

# add higlighted rectangles centered at 0
plt.axvspan(-0.25, 0.25, facecolor='tab:green', alpha=0.1)
plt.axvspan(0.75, 1.25, facecolor='tab:blue', alpha=0.1)
plt.axvspan(1.75, 2.25, facecolor='tab:orange', alpha=0.1)


# add vertical line
# add a horizontal line  between the start and end of each person's career
for idx,p in enumerate(daao[daao['Type'] == 'Residence'].sort_values('Start')['Event'].unique()):
    start = daao[(daao['Event']==p)]['Start'].min()
    end = daao[(daao['Event']==p)]['End'].max()
    if (start==end) | (start+1==end):

        sns.scatterplot(data=daao[daao['Event']==p].sort_values(['Start'], ascending=[True]),
        x=-2.2, y='Start',hue='Event', ax=ax, s=550, alpha=0.15, palette=['tab:blue'], legend=False)

        plt.scatter(data=daao[(daao['Event']==p) & (daao.Country != 'Australia') & (~daao.Country.isnull())].sort_values(['Start'], ascending=[True]),
            x=-2.2,y=2009, marker='x', color='black', s=200, zorder=10)

    else:
        if idx % 2 == 0: plt.plot([-2,-2], [start+0.4, end-0.4], linewidth=24, zorder=0, color = 'tab:blue', alpha=0.4)
        else: plt.plot([-2.2,-2.2], [start+0.4, end-0.4], linewidth=24, zorder=0, color = 'tab:blue', alpha=0.15)


# add annottation above the vertical line
plt.annotate('Residence', (-2.35, 1949-1.5), fontsize=15, alpha=1, color='black')


# add annottation above the vertical line
plt.annotate('Recognition', (3.3, 1949-1.5), fontsize=15, alpha=1, color='black')


# add text labels for each Residence event
for idx,p in enumerate(daao[daao['Type'] == 'Residence'].sort_values('Start')['Event'].unique()):
    start = daao[(daao['Event']==p)]['Start'].min()
    end = daao[(daao['Event']==p)]['End'].max()
    if (start==end) | (start+1==end):
        ax.annotate(p, (-2.3, start), fontsize=10, alpha=1, color='tab:blue')
    else:
        if idx % 2 == 0: ax.annotate(p, (-2.3, (start+end)/2), fontsize=10, alpha=1, color='tab:blue')
        else: ax.annotate(p, (-2.3, (start+end)/2), fontsize=10, alpha=1, color='tab:blue')

daao = daao[daao.Type != 'Residence']

for idx,x in enumerate(ausstage['Type']):
    y = ausstage[ausstage.Type.str.contains(x)]['Start'][idx]
    ax.annotate(x, (-.65, y), fontsize=10, alpha=1, color='tab:green')

for idx,x in enumerate(daao['Type'].unique()):
    y = george_df[(george_df.Dataset == 'DAAO') & (george_df.Type.str.contains(x))]['Start'].unique()
    for y in george_df[(george_df.Dataset == 'DAAO') & (george_df.Type.str.contains(x))]['Start'].unique():
        z = george_df[(george_df.Dataset == 'DAAO') & (george_df.Type.str.contains(x)) & (george_df.Start == y)]['Start'].iloc[0]
        if (x == 'Recognition'): ax.annotate(x, (3.95, z), fontsize=10, alpha=1, color='tab:blue')
        else:
            if idx % 2 == 0: ax.annotate(x, (0.5, z), fontsize=10, alpha=1, color='tab:blue')
            else: ax.annotate(x, (1.2, z), fontsize=10, alpha=1, color='tab:blue')

for idx,x in enumerate(imdb['Type'].unique()):
    y = george_df[(george_df.Dataset == 'IMDB') & (george_df.Type.str.contains(x))]['Start'].unique()
    for y in george_df[(george_df.Dataset == 'IMDB') & (george_df.Type.str.contains(x))]['Start'].unique():
        z = george_df[(george_df.Dataset == 'IMDB') & (george_df.Type.str.contains(x)) & (george_df.Start == y)]['Start'].iloc[0]
        if (x == 'Nominee'): ax.annotate(x, (3, z), fontsize=10, alpha=1, color='tab:orange')
        elif (x == 'Winner'): ax.annotate(x, (4, z), fontsize=10, alpha=1, color='tab:orange')
        else:
            ax.annotate(x, (2.25, z), fontsize=10, alpha=1, color='tab:orange')

plt.ylim(1941,2023)

# change the order of the y-axis
plt.gca().invert_yaxis()

# add more space between the x-axis ticks
plt.xticks(np.arange(0, 10, 1))

# move legend to specific location
# plt.legend(loc='upper right', fontsize=12, ncol=1, facecolor='white', bbox_to_anchor=(0.965, 0.97))
# for i in range(2): plt.gca().get_legend().legendHandles[i]._sizes = [200]

# remove the legend
plt.legend().remove()

# add vertical lines on 0,1,2
plt.axvline(x=-.85, color='black', alpha=0.4, linestyle='-', linewidth=1)
plt.axvline(x=2.95, color='black', alpha=0.4, linestyle='-', linewidth=1)
# plt.axvline(x=0, color='lightgrey', alpha=0.4, linestyle='-', linewidth=1)
# plt.axvline(x=1, color='lightgrey', alpha=0.4, linestyle='-', linewidth=1)
# plt.axvline(x=2, color='lightgrey', alpha=0.4, linestyle='-', linewidth=1)

# # add annotation top right of plot to denote the vertical lines
# plt.annotate('| = annual break', xy=(2006.5, -.5), fontsize=12, alpha=0.5)

#remove y-axis title
plt.ylabel('')

# increase y-axis limits to make room for the title
plt.xlim(-2.75, 4.75)
plt.show()
Show code cell source
# fig, ax = plt.subplots(figsize=(16,6))
# sns.scatterplot(data=george_df[george_df['Start'] >= 2004].sort_values('Start'),
# x='Start', y='Event',
# hue='Dataset', ax=ax, s=700, alpha=0.7, palette=['tab:orange','tab:green','tab:orange'])

# plt.legend(loc='lower left', fontsize=14, ncol=2, facecolor='white')
# # for i in range(6): plt.gca().get_legend().legendHandles[i]._sizes = [200]

# # make y-axis labels larger
# plt.yticks(fontsize=14); plt.xticks(fontsize=16)
# plt.ylabel(''); plt.xlabel('')

# # add y-axis grid
# plt.grid(axis='y', alpha=0.3)

# # add a title
# plt.title('Maria Kozic, 2004-2023' , fontsize=16)

# # # add annotation top right of plot to denote the vertical lines
# # plt.annotate('| = annual break', xy=(2006.5, -.5), fontsize=12, alpha=0.5)

# # move legend to specific location
# plt.legend(loc='upper right', fontsize=12, ncol=2, facecolor='white')
# for i in range(1): plt.gca().get_legend().legendHandles[i]._sizes = [400]

# # show each year on x-acis
# plt.xticks(np.arange(2004, 2024, 1))

# # increase y-axis limits to make room for the title
# plt.ylim(2.5, -1.25)

# plt.show()

Image(filename='images/images_analysis/ExternalDatasets_Maria_Trends.png')
4. Toni Matičevski#
Toni Matičevski is a Melbourne-based Australian fashion designer.
In the visual below, we show the number of roles recorded in AusStage (1), DAAO (3) and IMDb (1) for Toni Matičevski.
Show code cell source
Image(filename='images/images_analysis/ExternalDatasets_Toni.png')
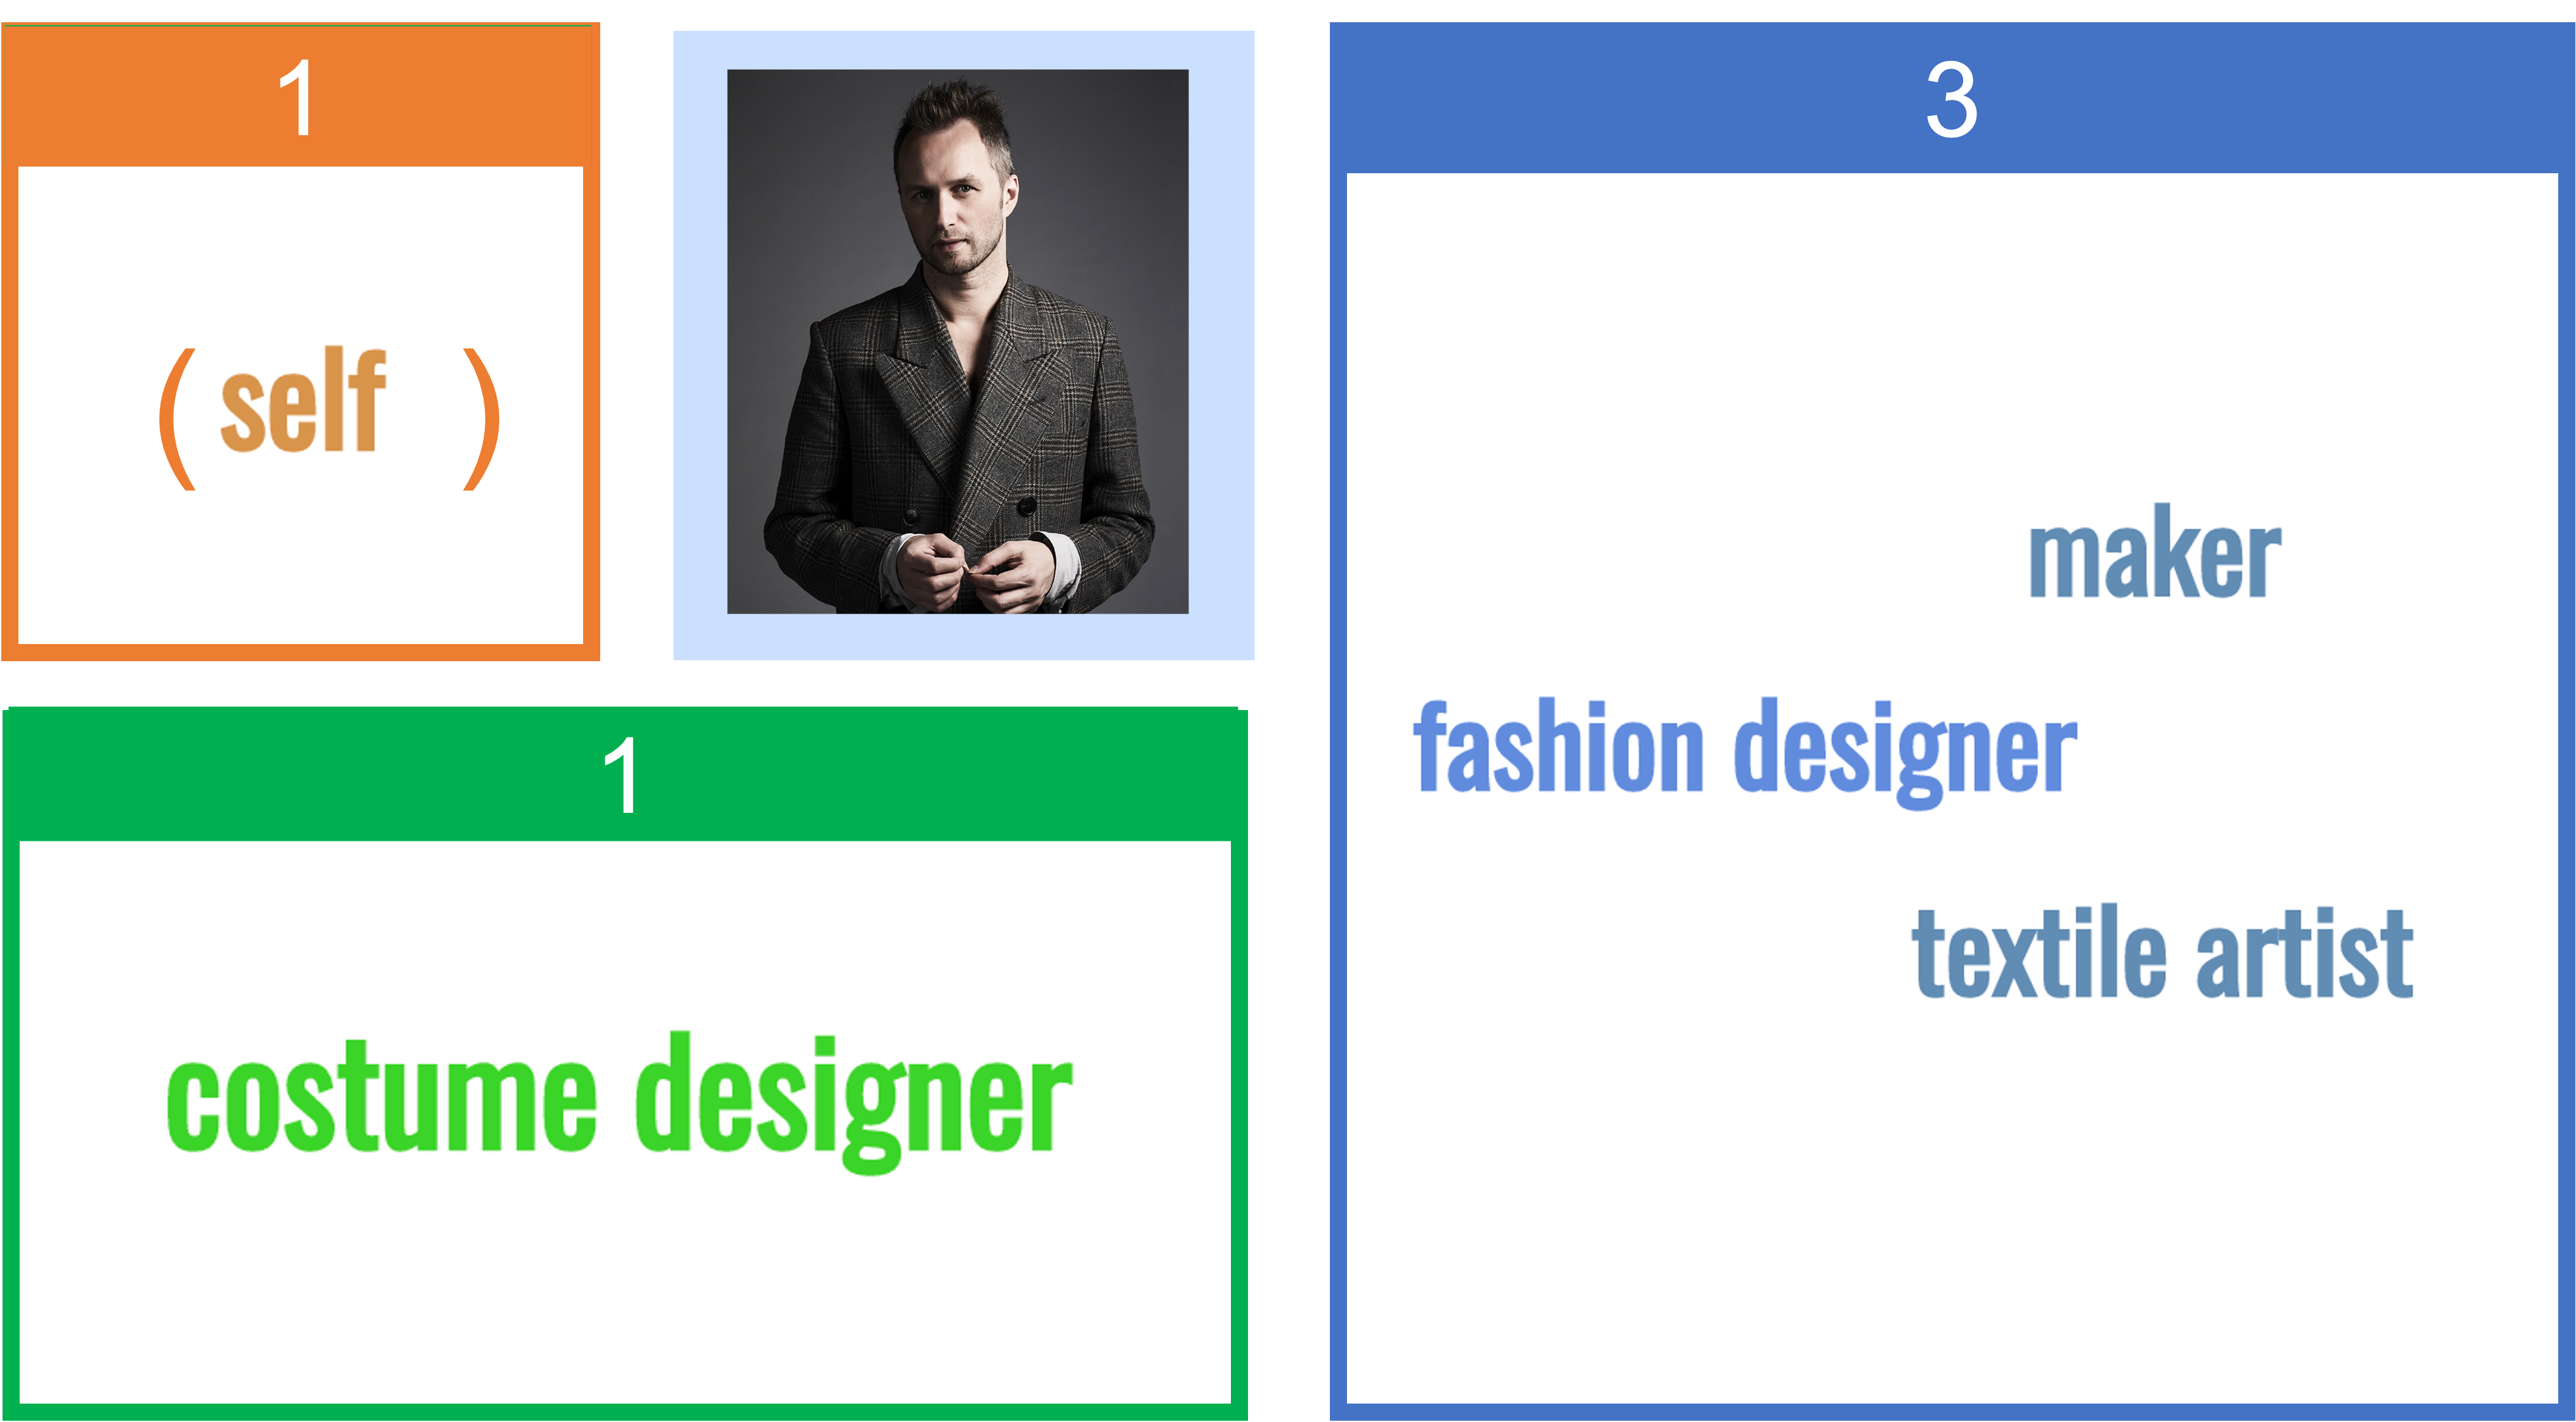
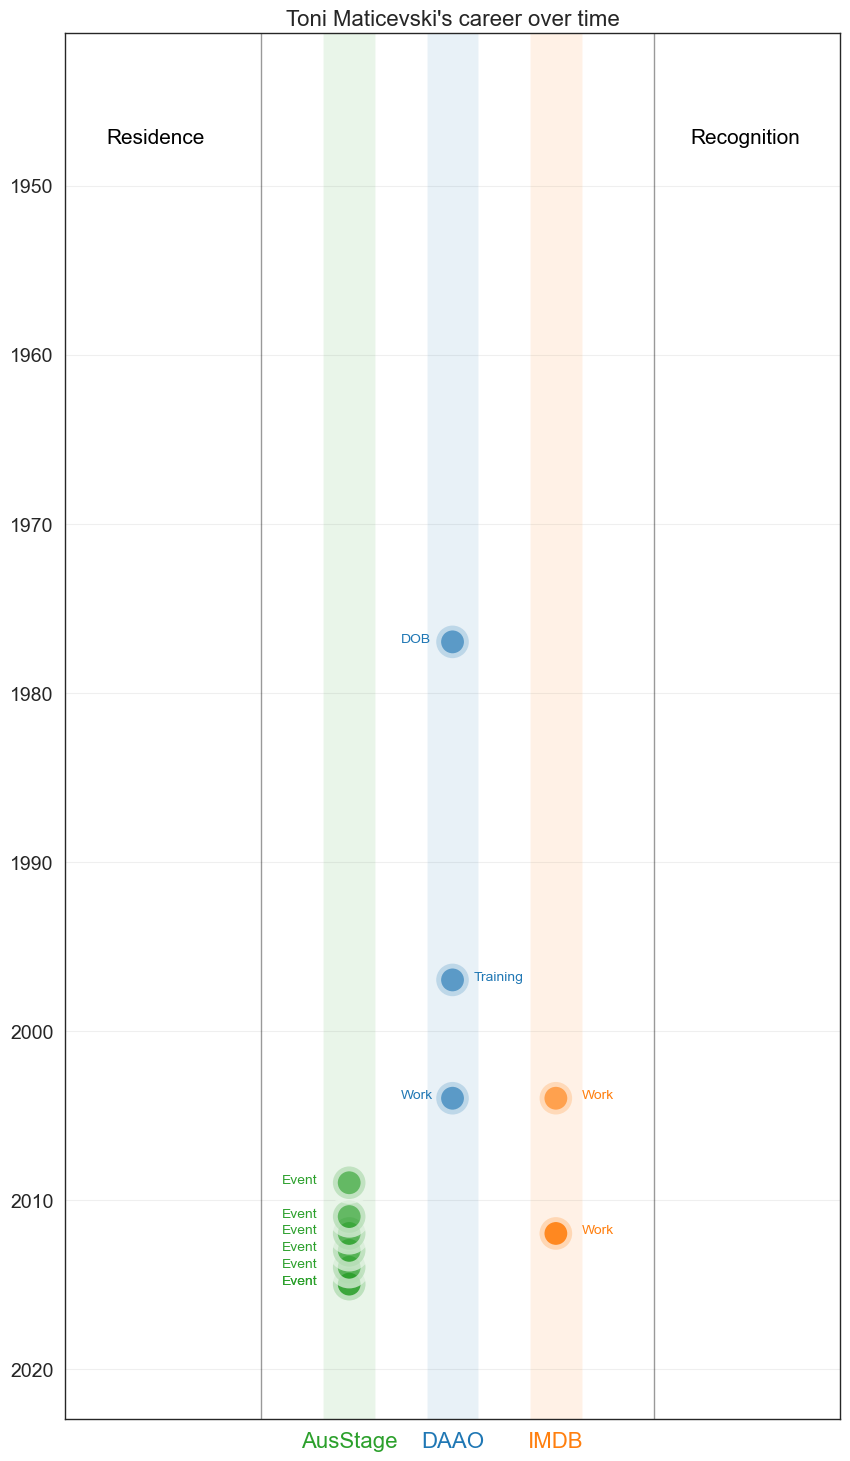
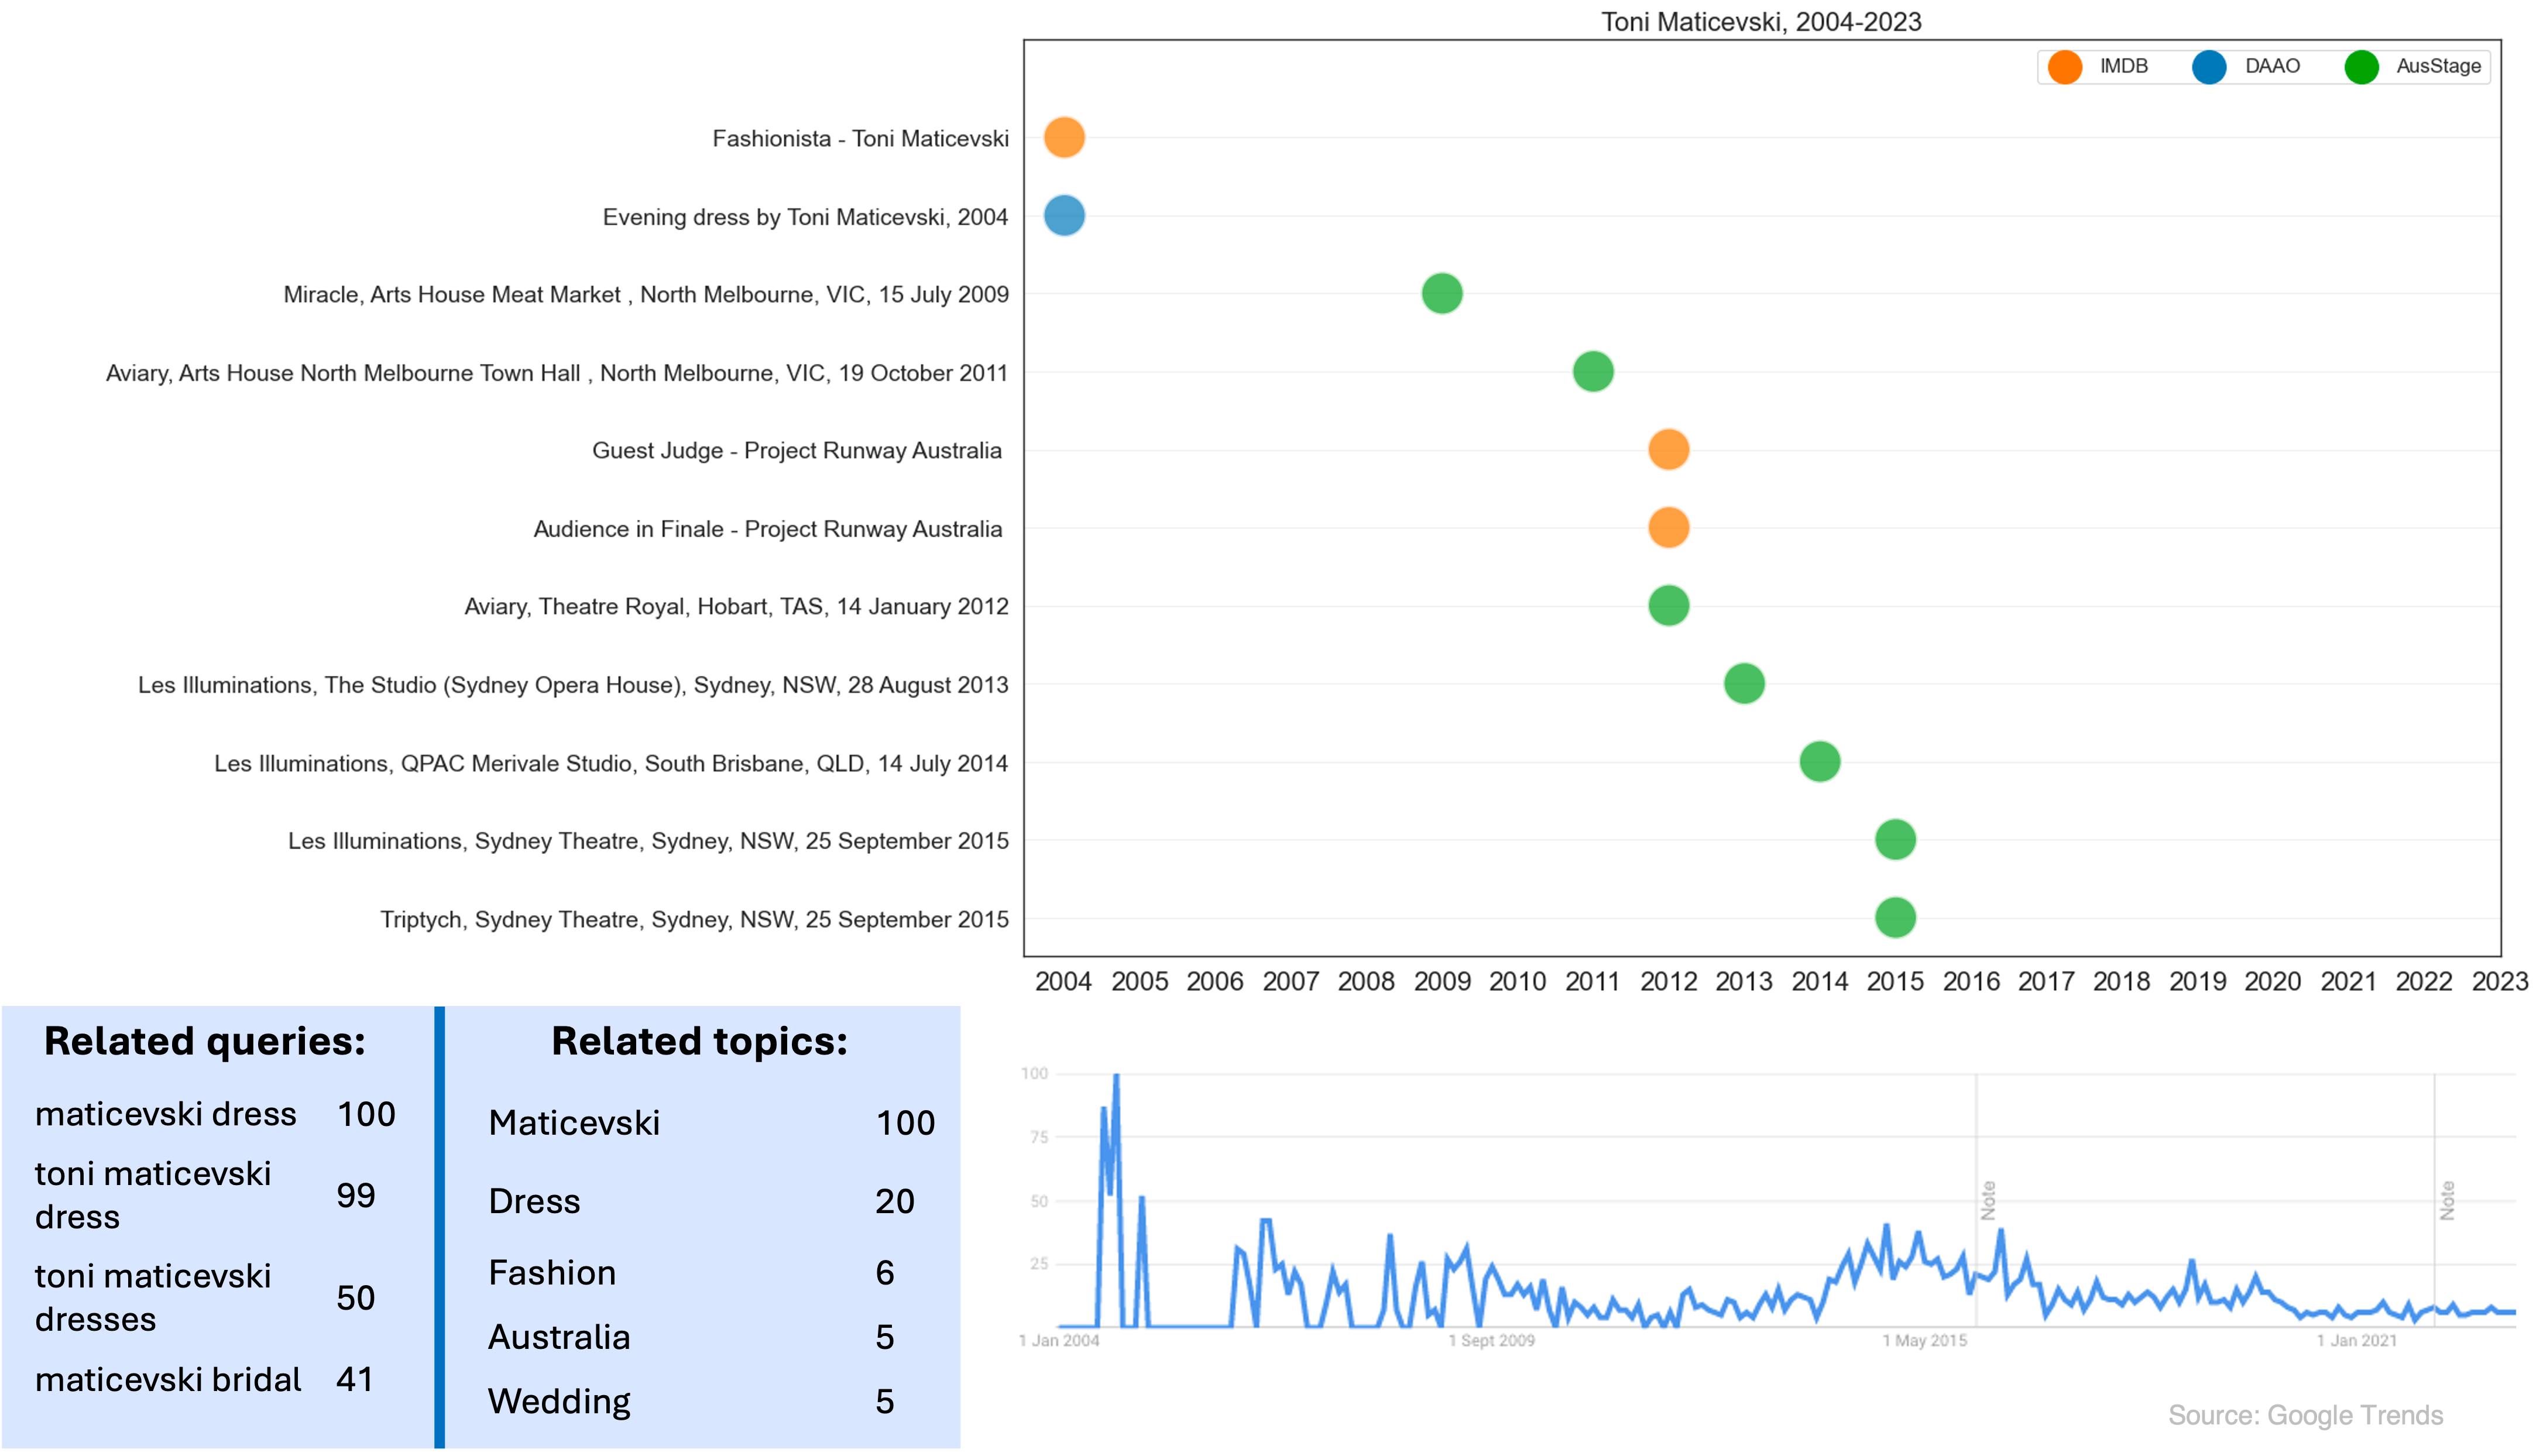
Toni’s trajectory has mainly been recorded in AusStage. His presence in IMDb is due to his guest appearances on reality television shows such as Fashionista and Project Runway.
Show code cell source
george_df = four_case_studies_df[four_case_studies_df.Person == 'Toni Maticevski']
g1 = george_df.copy()

ausstage = george_df[george_df.Dataset == 'AusStage'].reset_index(drop=True)
daao = george_df[george_df.Dataset == 'DAAO'].reset_index(drop=True)
imdb = george_df[george_df.Dataset == 'IMDB'].reset_index(drop=True)

g1 = g1[g1.Type != 'Residence']
g1_awards = g1[(g1.Type == 'Recognition') | (g1.Type == 'Winner') | (g1.Type == 'Nominee')]
g1 = g1[g1.Type != 'Winner']
g1 = g1[g1.Type != 'Nominee']
g1 = g1[g1.Type != 'Recognition']

fig, ax = plt.subplots(figsize=(10,18))
sns.scatterplot(data=g1.sort_values(['Dataset'], ascending=[True]),
x='Dataset', y='Start', hue='Dataset', ax=ax, s=550, alpha=0.7, linewidth=7,
palette=['tab:green','tab:blue','tab:orange'], legend=False)

plt.scatter(data=g1[(g1.Country != 'Australia') & (~g1.Country.isnull())].sort_values(['Dataset'], ascending=[True]),
            x='Dataset',y='Start', marker='x', color='black', s=200, zorder=10)

# change x-axis labels to be different colors
for label in ax.get_xticklabels():
    dataset_label = label.get_text()
    if dataset_label == 'AusStage': label.set_color('tab:green')
    elif dataset_label == 'DAAO': label.set_color('tab:blue')
    elif dataset_label == 'IMDB': label.set_color('tab:orange')

sns.scatterplot(data=g1_awards[g1_awards.Type != 'Recognition'].sort_values(['Dataset'], ascending=[True]),
x=3.75, y='Start', hue='Dataset', ax=ax, s=550, alpha=0.7, palette=['tab:orange'], legend=True,linewidth=7)

sns.scatterplot(data=g1_awards[g1_awards.Type == 'Recognition'].sort_values(['Dataset'], ascending=[True]),
x=3.75, y='Start', hue='Dataset', ax=ax, s=550, alpha=0.7, palette=['tab:blue'], legend=True, linewidth=7)

plt.legend(loc='lower left', fontsize=14, ncol=2, facecolor='white')
# for i in range(6): plt.gca().get_legend().legendHandles[i]._sizes = [200]

# make y-axis labels larger
plt.yticks(fontsize=14); plt.xticks(fontsize=16)
plt.ylabel(''); plt.xlabel('')

# add y-axis grid
plt.grid(axis='y', alpha=0.3)

# add a title
plt.title("Toni Maticevski's career over time" , fontsize=16)

# add higlighted rectangles centered at 0
plt.axvspan(-0.25, 0.25, facecolor='tab:green', alpha=0.1)
plt.axvspan(0.75, 1.25, facecolor='tab:blue', alpha=0.1)
plt.axvspan(1.75, 2.25, facecolor='tab:orange', alpha=0.1)


# add vertical line
# add a horizontal line  between the start and end of each person's career
for idx,p in enumerate(daao[daao['Type'] == 'Residence'].sort_values('Start')['Event'].unique()):
    start = daao[(daao['Event']==p)]['Start'].min()
    end = daao[(daao['Event']==p)]['End'].max()
    if (start==end) | (start+1==end):

        sns.scatterplot(data=daao[daao['Event']==p].sort_values(['Start'], ascending=[True]),
        x=-2.2, y='Start',hue='Event', ax=ax, s=550, alpha=0.15, palette=['tab:blue'], legend=False)

        plt.scatter(data=daao[(daao['Event']==p) & (daao.Country != 'Australia') & (~daao.Country.isnull())].sort_values(['Start'], ascending=[True]),
            x=-2.2,y=2009, marker='x', color='black', s=200, zorder=10)

    else:
        if idx % 2 == 0: plt.plot([-2,-2], [start+0.4, end-0.4], linewidth=24, zorder=0, color = 'tab:blue', alpha=0.4)
        else: plt.plot([-2.2,-2.2], [start+0.4, end-0.4], linewidth=24, zorder=0, color = 'tab:blue', alpha=0.15)


# add annottation above the vertical line
plt.annotate('Residence', (-2.35, 1949-1.5), fontsize=15, alpha=1, color='black')


# add annottation above the vertical line
plt.annotate('Recognition', (3.3, 1949-1.5), fontsize=15, alpha=1, color='black')


# add text labels for each Residence event
for idx,p in enumerate(daao[daao['Type'] == 'Residence'].sort_values('Start')['Event'].unique()):
    start = daao[(daao['Event']==p)]['Start'].min()
    end = daao[(daao['Event']==p)]['End'].max()
    if (start==end) | (start+1==end):
        ax.annotate(p, (-2.3, start), fontsize=10, alpha=1, color='tab:blue')
    else:
        if idx % 2 == 0: ax.annotate(p, (-2.3, (start+end)/2), fontsize=10, alpha=1, color='tab:blue')
        else: ax.annotate(p, (-2.3, (start+end)/2), fontsize=10, alpha=1, color='tab:blue')

daao = daao[daao.Type != 'Residence']

for idx,x in enumerate(ausstage['Type']):
    y = ausstage[ausstage.Type.str.contains(x)]['Start'][idx]
    ax.annotate(x, (-.65, y), fontsize=10, alpha=1, color='tab:green')

for idx,x in enumerate(daao['Type'].unique()):
    y = george_df[(george_df.Dataset == 'DAAO') & (george_df.Type.str.contains(x))]['Start'].unique()
    for y in george_df[(george_df.Dataset == 'DAAO') & (george_df.Type.str.contains(x))]['Start'].unique():
        z = george_df[(george_df.Dataset == 'DAAO') & (george_df.Type.str.contains(x)) & (george_df.Start == y)]['Start'].iloc[0]
        if (x == 'Recognition'): ax.annotate(x, (3.95, z), fontsize=10, alpha=1, color='tab:blue')
        else:
            if idx % 2 == 0: ax.annotate(x, (0.5, z), fontsize=10, alpha=1, color='tab:blue')
            else: ax.annotate(x, (1.2, z), fontsize=10, alpha=1, color='tab:blue')

for idx,x in enumerate(imdb['Type'].unique()):
    y = george_df[(george_df.Dataset == 'IMDB') & (george_df.Type.str.contains(x))]['Start'].unique()
    for y in george_df[(george_df.Dataset == 'IMDB') & (george_df.Type.str.contains(x))]['Start'].unique():
        z = george_df[(george_df.Dataset == 'IMDB') & (george_df.Type.str.contains(x)) & (george_df.Start == y)]['Start'].iloc[0]
        if (x == 'Nominee'): ax.annotate(x, (3, z), fontsize=10, alpha=1, color='tab:orange')
        elif (x == 'Winner'): ax.annotate(x, (4, z), fontsize=10, alpha=1, color='tab:orange')
        else:
            ax.annotate(x, (2.25, z), fontsize=10, alpha=1, color='tab:orange')

plt.ylim(1941,2023)

# change the order of the y-axis
plt.gca().invert_yaxis()

# add more space between the x-axis ticks
plt.xticks(np.arange(0, 10, 1))

# move legend to specific location
# plt.legend(loc='upper right', fontsize=12, ncol=1, facecolor='white', bbox_to_anchor=(0.965, 0.97))
# for i in range(2): plt.gca().get_legend().legendHandles[i]._sizes = [200]

# remove the legend
plt.legend().remove()

# add vertical lines on 0,1,2
plt.axvline(x=-.85, color='black', alpha=0.4, linestyle='-', linewidth=1)
plt.axvline(x=2.95, color='black', alpha=0.4, linestyle='-', linewidth=1)
# plt.axvline(x=0, color='lightgrey', alpha=0.4, linestyle='-', linewidth=1)
# plt.axvline(x=1, color='lightgrey', alpha=0.4, linestyle='-', linewidth=1)
# plt.axvline(x=2, color='lightgrey', alpha=0.4, linestyle='-', linewidth=1)

# # add annotation top right of plot to denote the vertical lines
# plt.annotate('| = annual break', xy=(2006.5, -.5), fontsize=12, alpha=0.5)

#remove y-axis title
plt.ylabel('')

# increase y-axis limits to make room for the title
plt.xlim(-2.75, 4.75)
plt.show()
Show code cell source
# fig, ax = plt.subplots(figsize=(16,10))
# sns.scatterplot(data=george_df[george_df['Start'] >= 2004].sort_values('Start'),
# x='Start', y='Event',
# hue='Dataset', ax=ax, s=700, alpha=0.7, palette=['tab:orange','tab:blue','tab:green'])

# plt.legend(loc='lower left', fontsize=14, ncol=2, facecolor='white')
# # for i in range(6): plt.gca().get_legend().legendHandles[i]._sizes = [200]

# # make y-axis labels larger
# plt.yticks(fontsize=14); plt.xticks(fontsize=16)
# plt.ylabel(''); plt.xlabel('')

# # add y-axis grid
# plt.grid(axis='y', alpha=0.3)

# # add a title
# plt.title('Toni Maticevski, 2004-2023' , fontsize=16)

# # # add annotation top right of plot to denote the vertical lines
# # plt.annotate('| = annual break', xy=(2006.5, -.5), fontsize=12, alpha=0.5)

# # move legend to specific location
# plt.legend(loc='upper right', fontsize=12, ncol=3, facecolor='white')
# for i in range(3): plt.gca().get_legend().legendHandles[i]._sizes = [400]

# # show each year on x-acis
# plt.xticks(np.arange(2004, 2024, 1))

# # increase y-axis limits to make room for the title
# plt.ylim(10.5, -1.25)

# plt.show()

Image(filename='images/images_analysis/ExternalDatasets_Toni_Trends.png')
DAAO and AustLit#
This is an exploratory comparative analysis of collected data from DAAO and AustLit. To extract data from the Austlit website, we built a scraping script to identify matches with the DAAO 500 (500 person records with the richest data). We drilldown on a few case studies.
The work presented form part of ACDE’s presentation at the ASAL & ASLEC-ANZ 2023 Conference, an event held in July 2023. More info here.
Import packages and pre-process data#
We have provided the code used to generate the DAAO 500 data, but for the sake of brevity we will not run the pre-processing code here. Instead, we will import pre-processed data from the data/analysis folder located in Github.
Show code cell source
def fetch_top_500(fname = 'DAAO_500_data.csv'):
    # first check if the data exists in current directory
    data_from_path = check_if_csv_exists_in_folder(fname)
    if data_from_path is not None: return data_from_path

    acde_persons = fetch_data(acdedata='person') # 16s
    daao_persons = acde_persons[acde_persons['data_source'].str.contains('DAAO')].copy()
    daao_persons['ori_url2'] = daao_persons['ori_url'].apply(lambda x: eval(x))

    top500 = fetch_small_data_from_github('DAAO_500_list.csv')

    # find matches with unified data
    top500_df = pd.DataFrame()
    for i in top500['ori_url']: top500_df = pd.concat([top500_df, daao_persons[daao_persons['ori_url2'] == i]])

    # remove last column of the dataframe and return df
    return top500_df.iloc[:, :-1]

df = fetch_top_500()
Scraping from AustLit website#
We iterate over each artist/designer in the DAAO 500. This process takes up to one hour to run. Matches are identified by comparing the name of the artist/designer in the DAAO 500 with the name of the top search result in AustLit. We provide a table of the matching accuracy of names in the DAAO and names in Austlit.
Show code cell source
# # Create a new dataframe to store the scraped results
# result_data = []

# # Iterate over the rows - this takes 50 mins
# for index, row in df.iterrows():
#     # Concatenate the given_names and family_name columns to get the full name
#     full_name = f"{json.loads(row.primary_name)['given_names']} {json.loads(row.primary_name)['family_name']}"

#     # Construct the URL for the search page
#     query = full_name.replace(' ', '+')
#     url_all = f'https://www.austlit.edu.au/austlit/search2/page?query={query}'
#     url_agent = f'https://www.austlit.edu.au/austlit/search2/page?query={query}&scope=agent'

#     for idx, url in enumerate([url_all, url_agent]):
#         # Send a GET request to the search page
#         response = requests.get(url)
#         soup = BeautifulSoup(response.content, 'html.parser')

#         # Extract the top result name and link if available
#         top_result = soup.find('a', class_='austlitLink-agent')
#         if top_result is not None:
#             top_result_name = top_result.span.get_text()
#             top_result_link = 'https://www.austlit.edu.au' + top_result['href']
#         else:
#             top_result_name = 'No Result Found'
#             top_result_link = ''

#         # Append the results to the data list
#         if idx == 0: result_data.append({'FullName': full_name, 'TopResultName': top_result_name, 'TopResultLink': top_result_link})
#         else: result_data[-1].update({'TopResultName2': top_result_name, 'TopResultLink2': top_result_link})

#         # Pause for a short duration
#         time.sleep(0.5)  # Adjust the duration as needed

#         if top_result_name == 'No Result Found':
#             result_data[-1].update({'TopResultName2': top_result_name, 'TopResultLink2': top_result_link})
#             break

#     # Print progress and data being saved
#     print(f"Processed {index+1}/{len(df)}: {full_name}")

# # Create a new dataframe from the result data
# result_df = pd.DataFrame(result_data, columns=['FullName', 'TopResultName', 'TopResultLink', 'TopResultName2', 'TopResultLink2'])

# df['display_name'] = df['display_name'].apply(lambda x: ast.literal_eval(x))
# result_df = pd.merge(result_df, df[['primary_name','display_name']], left_on='FullName', right_on='display_name', how='right')
# result_df['Surname'] = df['primary_name'].apply(lambda x: json.loads(x)['family_name'])
# result_df = result_df[result_df['TopResultName'].notnull()].drop_duplicates().drop(columns=['display_name', 'primary_name'], axis=1)

# result_df['SelectedName'] = np.where(result_df['TopResultName'] == result_df['TopResultName2'], result_df['TopResultName'], np.nan)
# result_df['SelectedLink'] = np.where(result_df['TopResultName'] == result_df['TopResultName2'], result_df['TopResultLink'], np.nan)
# result_df['Type'] = np.where(result_df.SelectedName == 'No Result Found', 'No match', np.nan)
# result_df['Type'] = np.where((result_df.SelectedName.notnull()) & (result_df.Type != 'No match'), 'Most likely a match', result_df.Type)

# result_df['SelectedName'] = np.where((result_df['TopResultName'] != result_df['TopResultName2']) &\
#                                      (result_df['FullName'] == result_df['TopResultName2']), result_df['TopResultName2'], result_df['SelectedName'])
# result_df['SelectedLink'] = np.where((result_df['TopResultName'] != result_df['TopResultName2']) &\
#                                         (result_df['FullName'] == result_df['TopResultName2']), result_df['TopResultLink2'], result_df['SelectedLink'])
# result_df['Type'] = np.where((result_df.SelectedName.notnull()) & (result_df.Type == 'nan'), 'Most likely a match', result_df.Type)

# result_df['TopResultName_LastStr'] = result_df['TopResultName'].apply(lambda x: x.split(' ')[-1])
# result_df['TopResultName2_LastStr'] = result_df['TopResultName2'].apply(lambda x: x.split(' ')[-1])

# result_df['Type'] = np.where((result_df.SelectedName.isnull()) & (result_df.Surname == result_df.TopResultName_LastStr), 'No match, but related record with same surname', result_df.Type)
# result_df['SelectedName'] = np.where((result_df.SelectedName.isnull()) & (result_df.Surname == result_df.TopResultName_LastStr), result_df.TopResultName, result_df.SelectedName)
# result_df['SelectedLink'] = np.where((result_df.SelectedLink.isnull()) & (result_df.Surname == result_df.TopResultName_LastStr), result_df.TopResultLink, result_df.SelectedLink)

# result_df['Type'] = np.where((result_df.SelectedName.isnull()) & (result_df.Surname == result_df.TopResultName2_LastStr), 'No match, but related record with same surname', result_df.Type)
# result_df['SelectedName'] = np.where((result_df.SelectedName.isnull()) & (result_df.Surname == result_df.TopResultName2_LastStr), result_df.TopResultName2, result_df.SelectedName)
# result_df['SelectedLink'] = np.where((result_df.SelectedLink.isnull()) & (result_df.Surname == result_df.TopResultName2_LastStr), result_df.TopResultLink2, result_df.SelectedLink)

# result_df['Type'] = np.where(result_df.SelectedName.isnull(), 'No match, but related record', result_df.Type)
# result_df['Type'] = np.where((result_df.Type == 'Most likely a match') & (result_df.SelectedName == result_df.FullName), 'Exact match', result_df.Type)
# # result_df.to_csv('data/for_manual_inspection.csv', index=False)
# result_df['Type'].value_counts()

print('No match                                          172')
print('Exact match                                       171')
print('No match, but related record                      111')
print('Most likely a match                                43')
print('No match, but related record with same surname      1')
No match                                          172
Exact match                                       171
No match, but related record                      111
Most likely a match                                43
No match, but related record with same surname      1
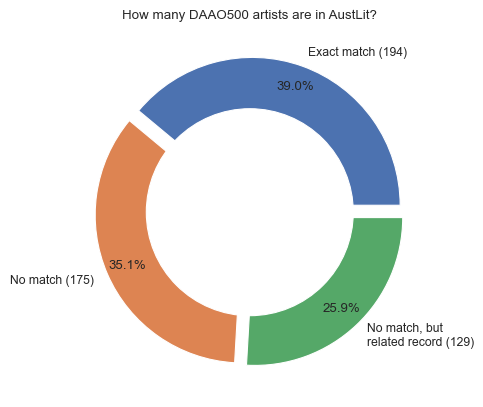
High-level summary of matching accuracy#
After inspecting the list of search prompts and matches, we manually edited a few instances for the sake of accuracy. Below we visualise a further summarised breakdown of the data. We continue our analysis with exact match cases (194).
Show code cell source
# Read the CSV file
result_df_manually_edited = fetch_small_data_from_github('DAAO_AustLit_exactmatches.csv')

# print('Most frequently occurring values when searching all results:')
# print('------------------------------------------------------------')
# print(result_df_manually_edited.TopResultName.value_counts().head(5),'\n')
# print('Most frequently occurring values when searching only agents:')
# print('------------------------------------------------------------')
# print(result_df_manually_edited.TopResultName2.value_counts().head(5),'\n')

# plot pie chart and increase size of labels
result_df_type=pd.DataFrame(dict(Counter(result_df_manually_edited["Type"])).items(),
                            columns=["Type","Frequency"])

# explosion
explode = (0.05, 0.05, 0.05)

# Pie Chart
plt.pie(result_df_type['Frequency'], labels=['Exact match (194)','No match (175)','No match, but \nrelated record (129)'],
        autopct='%1.1f%%', pctdistance=0.85,
        explode=explode)

# draw circle
centre_circle = plt.Circle((0, 0, 0), 0.70, fc='white')
fig = plt.gcf()

# Adding Circle in Pie chart
fig.gca().add_artist(centre_circle)

# Adding Title of chart
plt.title('How many DAAO500 artists are in AustLit?')

# Displaying Chart
plt.show()
Exact matches - Scrape more data from AustLit#
The above scraping process allows us to check for matches based on the top search results, however we need to build a more complicated scraping process once we want to extract more detailled data for certain people records within AustLit. This is because this data is only accessible for logged in users.
We have provided an modified scraping script below which uses exported cookies to bypass the need of using browserless scraping. The code below is not dynamic and you will need to follow the steps outlined in this link to set up your header parameters.
As this process takes roughly 25 minutes, we will not run the pre-processing code here, instead we will import pre-processed data from the data/analysis folder located in Github. We provide a snapshot of the scraped data below.
Show code cell source
# exact_matches = result_df_manually_edited[result_df_manually_edited['Type'] == 'Exact match'][['FullName', 'SelectedName', 'SelectedLink']]

# # replace AustLit links with OpenAthens links
# # this allows us to maintain logged in access to AustLit records
# exact_matches['SelectedLink_LoggedIn'] = exact_matches['SelectedLink']
# exact_matches['SelectedLink_LoggedIn'] = exact_matches['SelectedLink_LoggedIn']\
#     .apply(lambda x: x.replace('https://www.austlit.edu.au/',
#                                'https://www-austlit-edu-au.eu1.proxy.openathens.net/'))

# exact_matches.reset_index(drop=True, inplace=True)

# # semi-automated way of bypassing login details
# # follow this link for more info: https://stackoverflow.com/a/61140905
# cookies = {
#     'oamps': 'eyJ0eXAiOiJKV1QiLCJhbGciOiJIUzI1NiJ9.eyJwIjpbImE0YmYxOWMyLWJhZjQtNGE2NS1iZTI4LWU2Nzc5MWZkMjI4YiJdLCJkIjoidW5pbWVsYi5lZHUuYXUiLCJlIjoiaHR0cHM6Ly9pZHAudW5pbWVsYi5lZHUuYXUvb3BlbmF0aGVucyIsIm9yZyI6IjcxNjg1NzE0IiwiaWQiOiI4ODgwNzhjZi0xMDQyLTQzZGItOTc3Ni1iMGRmYjY1NjgyODgiLCJleHAiOjE2ODgwNzYyNzgsImNwIjpmYWxzZSwiY3IiOmZhbHNlfQ.AVmo1WzZbvyN98fAUkOQWbWGbrh1b5XYTbOCfHelUu0',
# }

# headers = {
#     'authority': 'www-austlit-edu-au.eu1.proxy.openathens.net',
#     'accept': 'text/html,application/xhtml+xml,application/xml;q=0.9,image/avif,image/webp,image/apng,*/*;q=0.8',
#     'accept-language': 'en-US,en;q=0.5',
#     'cache-control': 'max-age=0',
#     # 'cookie': 'oamps=eyJ0eXAiOiJKV1QiLCJhbGciOiJIUzI1NiJ9.eyJwIjpbImE0YmYxOWMyLWJhZjQtNGE2NS1iZTI4LWU2Nzc5MWZkMjI4YiJdLCJkIjoidW5pbWVsYi5lZHUuYXUiLCJlIjoiaHR0cHM6Ly9pZHAudW5pbWVsYi5lZHUuYXUvb3BlbmF0aGVucyIsIm9yZyI6IjcxNjg1NzE0IiwiaWQiOiI4ODgwNzhjZi0xMDQyLTQzZGItOTc3Ni1iMGRmYjY1NjgyODgiLCJleHAiOjE2ODgwNzYyNzgsImNwIjpmYWxzZSwiY3IiOmZhbHNlfQ.AVmo1WzZbvyN98fAUkOQWbWGbrh1b5XYTbOCfHelUu0',
#     'referer': 'https://login.openathens.net/',
#     'sec-ch-ua': '"Not.A/Brand";v="8", "Chromium";v="114", "Brave";v="114"',
#     'sec-ch-ua-mobile': '?0',
#     'sec-ch-ua-platform': '"macOS"',
#     'sec-fetch-dest': 'document',
#     'sec-fetch-mode': 'navigate',
#     'sec-fetch-site': 'same-site',
#     'sec-fetch-user': '?1',
#     'sec-gpc': '1',
#     'upgrade-insecure-requests': '1',
#     'user-agent': 'Mozilla/5.0 (Macintosh; Intel Mac OS X 10_15_7) AppleWebKit/537.36 (KHTML, like Gecko) Chrome/114.0.0.0 Safari/537.36',
# }


# # Create a new dataframe to store the scraped results
# result_data = []
# over1000 = ''

# # Iterate over the rows - this takes 25 mins
# for index, row in exact_matches.iterrows():
#     url = row['SelectedLink']
#     # Send a GET request to the search page
#     response = requests.get(url)
#     soup = BeautifulSoup(response.content, 'html.parser')

#     # Extract the top result name and link if available
#     text_agent = soup.get_text()
#     result_data.append({'AgentText': text_agent})

#     works_dict = {'agentWorksBy': 'austlit-toc',
#                   'agentWorksAbout': 'austlit-works-about',
#                   'agentWorksWorks': 'austlit-toc'}

#     for section in works_dict.keys():
#         # Pause for a short duration
#         time.sleep(0.5)  # Adjust the duration as needed
#         response = requests.get(f'{row["SelectedLink_LoggedIn"]}?mainTabTemplate={section}&from=0&count=1000',
#                                 cookies=cookies, headers=headers)

#         soup = BeautifulSoup(response.content, 'html.parser')
#         text_works = soup.find('div', class_=works_dict[section])
#         works_count = len(text_works.find_all('a', class_='austlitLink-work property link neoaust-austlitId title'))

#         if works_count > 1000: over1000 = section

#         result_data[-1].update({section: text_works.get_text()})

#     # Print progress and data being saved
#     print(f"Processed {index+1}/{len(exact_matches)}: {url.split('/')[-1]}")

#     if over1000 != '': print(f'WARNING: over 1000 works found for {url.split("/")[-1]} in {over1000} section. Please review.\n')

# # Create a new dataframe from the result data
# result_detailled_df = pd.DataFrame(result_data, columns=['AgentText', 'agentWorksBy', 'agentWorksAbout', 'agentWorksWorks'])
# result_detailled_df = pd.concat([exact_matches, result_detailled_df], axis=1)

# # Save the results to a new CSV file
# result_detailled_df.to_csv('data/Austlist_DAAO_detailled.csv', index=False)
Show code cell source
df_detailled = fetch_small_data_from_github('DAAO_AustLit_exactmatches_detailed.csv')

# Clean textual sections
df_detailled['AgentText_Bio'] = df_detailled['AgentText'].apply(lambda x: x\
                                                .split('×Bio changes summary\nClose')[-1]\
                                                .split('Most Referenced Works')[0]\
                                                .replace('\n', ' ')\
                                                .replace('\t', ' ')\
                                                .replace("\'", "")\
                                                .replace("  ", " ")\
                                                .strip() if "×Bio" in x else '')

df_detailled['AgentText_Notes'] = df_detailled['AgentText'].apply(lambda x: x.split('Notes')[-1]\
                                            .split('Last amended')[0]\
                                            .split('Awards for Works')[0]\
                                            .replace('\n', ' ')\
                                            .replace('\t', ' ')\
                                            .replace("\'", "")\
                                            .replace("  ", " ")\
                                            .strip() if "Notes" in x else '')

df_detailled['AgentText_Awards'] = df_detailled['AgentText'].apply(lambda x: x.split('Awards for Works')[-1]\
                                            .split('VIEW ALL AWARDS')[0]\
                                            .replace('\n', ' ')\
                                            .replace('\t', ' ')\
                                            .replace("\'", "")\
                                            .replace("  ", " ")\
                                            .strip() if "Awards for Works" in x else '')

df_detailled['agentWorksBy'] = df_detailled['agentWorksBy'].apply(lambda x: x\
                                                .replace('\nWorks ByPreview all','')\
                                                .replace('\n', ' ')\
                                                .replace('\t', ' ')\
                                                .replace("\'", "")\
                                                .replace("  ", " ")\
                                                .strip())

df_detailled['agentWorksAbout'] = df_detailled['agentWorksAbout'].apply(lambda x: x\
                                                .replace('\nWorks AboutPreview all','')\
                                                .replace('\n', ' ')\
                                                .replace('\t', ' ')\
                                                .replace("\'", "")\
                                                .replace("  ", " ")\
                                                .strip())

df_detailled['agentWorksWorks'] = df_detailled['agentWorksWorks'].apply(lambda x: x\
                                                .replace('\nWorks About Their WorksPreview all','')\
                                                .replace('\n', ' ')\
                                                .replace('\t', ' ')\
                                                .replace("\'", "")\
                                                .replace("  ", " ")\
                                                .strip())
df_detailled.head(2).tail(1).T
| 1 | |
|---|---|
| FullName | Ian Abdulla |
| SelectedName | Ian Abdulla |
| SelectedLink | https://www.austlit.edu.au/austlit/page/A48552 |
| SelectedLink_LoggedIn | https://www-austlit-edu-au.eu1.proxy.openathen... |
| AgentText | \n\n\n\n \n\n\n\n\n\n\n\n\n\n\n\n\n\n\n\n\n\n... |
| agentWorksBy | 1 4 y Tucker Ian Abdulla /specialistDat... |
| agentWorksAbout | 1 Narratives of Charm and Wit John Kean , ... |
| agentWorksWorks | 1 As I Grew Older Written and Illustrated by... |
| AgentText_Bio | Ian Abdullas mother, Jemima Hunter, was from R... |
| AgentText_Notes | The National Library of Australia also holds a... |
| AgentText_Awards | y Tucker South Australia : Omnibus Boo... |
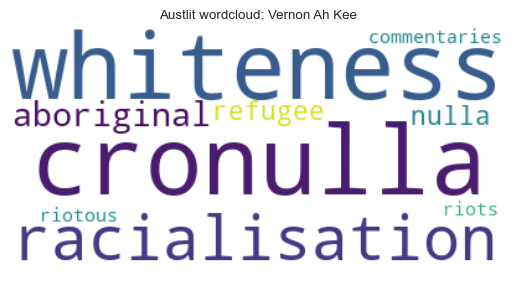
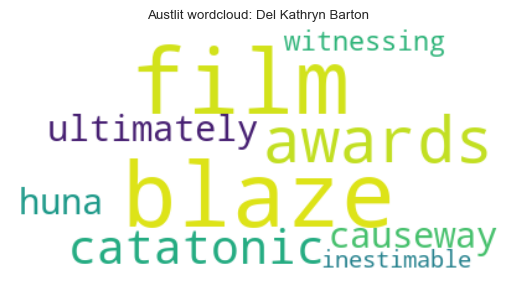
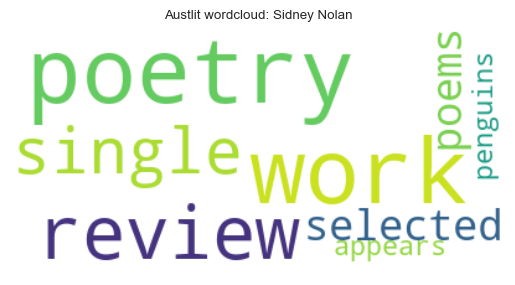
Comparing word clouds#
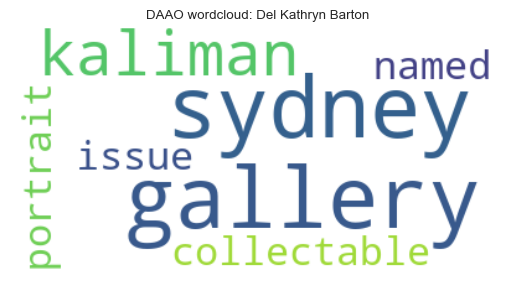
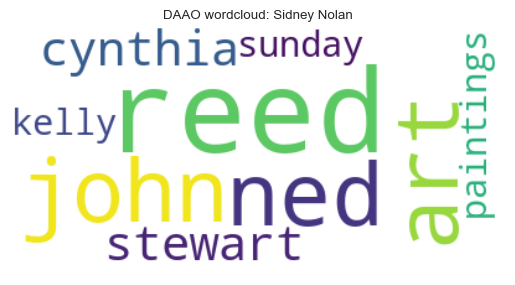
We generate word clouds for three case studies to showcase the different language used for each artist in the DAAO and AustLit. The words displayed in the word clouds are the most frequent distinct words used in the biographical notes of each artist.
For example, in AustLit, Vernon Ah Kee is represented by terms such as racialisation, cronulla and whiteness. In contrast, in the DAAO, Vernon Ah Kee is represented by terms such as artlines, and portraits.
Show code cell source
import nltk
from nltk.corpus import stopwords
from nltk.tokenize import word_tokenize
from sklearn.feature_extraction.text import TfidfVectorizer
from wordcloud import WordCloud

# Step 1: Prepare your corpus
austlit_bios = (df_detailled['AgentText_Bio'] + ' ' + df_detailled['AgentText_Notes'] + ' ' + \
                df_detailled['AgentText_Awards'] + ' ' + df_detailled['agentWorksBy'] + ' ' + \
                df_detailled['agentWorksAbout'] + ' ' + df_detailled['agentWorksWorks']).to_list()

# Step 2: Preprocess the text
# nltk.download('stopwords')
# nltk.download('punkt')

stop_words = set(stopwords.words('english'))

def preprocess_text(text):
    # Lowercase the text
    text = text.lower()

    # Tokenize the text
    tokens = word_tokenize(text)

    # Remove stopwords
    tokens = [token for token in tokens if token not in stop_words]

    return ' '.join(tokens)

preprocessed_corpus = [preprocess_text(biography) for biography in austlit_bios]

# for each element, remove the full name of the artist
for i, biography in enumerate(preprocessed_corpus):
    artist_names = df_detailled.iloc[i].FullName.split(' ')
    for name in artist_names:
        preprocessed_corpus[i] = preprocessed_corpus[i]\
            .replace(name.lower(), '')\
            .replace('blackwords', '')\
            .replace('specialistdatasets', '')


# Step 3-5: Calculate TF-IDF scores
vectorizer = TfidfVectorizer()
tfidf_matrix = vectorizer.fit_transform(preprocessed_corpus)

terms = vectorizer.get_feature_names()
idf_scores = vectorizer.idf_
tfidf_scores = tfidf_matrix.toarray()

# Step 6: Extract distinctive terms for each artist
num_distinctive_terms = 10

# for i, biography in enumerate(preprocessed_corpus):
#     artist_name = df.iloc[i].FullName
#     tfidf_scores_artist = tfidf_scores[i]

#     # Sort terms based on TF-IDF scores
#     sorted_indices = tfidf_scores_artist.argsort()[::-1]
#     distinctive_terms = [terms[idx] for idx in sorted_indices[:num_distinctive_terms]]

#     print(f"{artist_name}: {distinctive_terms}")

#     # Step 7: Generate word cloud
#     wordcloud = WordCloud(background_color='white').generate(' '.join(distinctive_terms))
#     plt.figure()
#     plt.imshow(wordcloud, interpolation='bilinear')
#     plt.axis('off')
#     plt.title(f"Austlit wordcloud: {artist_name}")
#     plt.show()

#     if i == 4: break

for i, biography in enumerate(preprocessed_corpus):
    if ('Sidney' in df_detailled.iloc[i].FullName) | ('Barton' in df_detailled.iloc[i].FullName) | ('Vernon' in df_detailled.iloc[i].FullName):
        artist_name = df_detailled.iloc[i].FullName
        tfidf_scores_artist = tfidf_scores[i]

        # Sort terms based on TF-IDF scores
        sorted_indices = tfidf_scores_artist.argsort()[::-1]
        distinctive_terms = [terms[idx] for idx in sorted_indices[:num_distinctive_terms]]

        # print(f"{artist_name}: {distinctive_terms}")

        # Step 7: Generate word cloud
        wordcloud = WordCloud(background_color='white').generate(' '.join(distinctive_terms))
        plt.figure()
        plt.imshow(wordcloud, interpolation='bilinear')
        plt.axis('off')
        plt.title(f"Austlit wordcloud: {artist_name}")
        plt.show()
Show code cell source
# df_merged = pd.merge(exact_matches, df[['display_name','ori_url']], left_on='FullName', right_on="display_name", how='left')
# df_merged = df_merged[df_merged['ori_url'].notnull()]
# df_merged['ori_url'] = df_merged['ori_url'].apply(lambda x: ast.literal_eval(x))

# # Create a new dataframe to store the scraped results
# daao_bios = []

# # Iterate over the rows - this takes 5 mins
# for index, row in df_merged.iloc[0:1].iterrows():
#     # Send a GET request to the search page
#     response = requests.get(row.ori_url + '/biography')
#     soup = BeautifulSoup(response.content, 'html.parser')

#     # Extract bio
#     this_bio = soup.find('div', class_='body ui-accordion-content ui-helper-reset ui-widget-content ui-corner-bottom')

#     try: this_bio.find('dl').decompose()
#     except: pass

#     try: this_bio = this_bio.get_text()
#     except: this_bio = ''

#     daao_bios.append(this_bio)

#     # Print progress and data being saved
#     print(f"Processed {index+1}/{len(df_merged)}")
#     time.sleep(0.25)

# ## Create a new dataframe from the result data
# df['daao_bios'] = daao_bios
# df[['FullName','daao_bios']].to_csv('data/daao500_bios.csv', index=False)

# read the csv file
daao_bios_df = fetch_small_data_from_github('DAAO_500_bios.csv')
daao_bios_df['daao_bios'].fillna('', inplace=True)

# Step 1: Prepare your corpus
daao_bios = daao_bios_df['daao_bios'].to_list()

# Step 2: Preprocess the text
# nltk.download('stopwords')
# nltk.download('punkt')

stop_words = set(stopwords.words('english'))

def preprocess_text(text):
    # Lowercase the text
    text = text.lower()

    # Tokenize the text
    tokens = word_tokenize(text)

    # Remove stopwords
    tokens = [token for token in tokens if token not in stop_words]

    return ' '.join(tokens)

preprocessed_corpus = [preprocess_text(biography) for biography in daao_bios]

# for each element, remove the full name of the artist
for i, biography in enumerate(preprocessed_corpus):
    artist_names = daao_bios_df.iloc[i].FullName.split(' ')
    for name in artist_names: preprocessed_corpus[i] = preprocessed_corpus[i].replace(name.lower(), '')

# Step 3-5: Calculate TF-IDF scores
vectorizer = TfidfVectorizer()
tfidf_matrix = vectorizer.fit_transform(preprocessed_corpus)

terms = vectorizer.get_feature_names()
idf_scores = vectorizer.idf_
tfidf_scores = tfidf_matrix.toarray()

# Step 6: Extract distinctive terms for each artist
num_distinctive_terms = 10

# for i, biography in enumerate(preprocessed_corpus):
#     artist_name = daao_bios_df.iloc[i].FullName
#     tfidf_scores_artist = tfidf_scores[i]

#     # Sort terms based on TF-IDF scores
#     sorted_indices = tfidf_scores_artist.argsort()[::-1]
#     distinctive_terms = [terms[idx] for idx in sorted_indices[:num_distinctive_terms]]

#     print(f"{artist_name}: {distinctive_terms}")

#     # Step 7: Generate word cloud
#     wordcloud = WordCloud(background_color='white').generate(' '.join(distinctive_terms))
#     plt.figure()
#     plt.imshow(wordcloud, interpolation='bilinear')
#     plt.axis('off')
#     plt.title(f"Austlit wordcloud: {artist_name}")
#     plt.show()

#     if i == 4: break

for i, biography in enumerate(preprocessed_corpus):
    if ('Sidney' in daao_bios_df.iloc[i].FullName) | ('Barton' in daao_bios_df.iloc[i].FullName) | ('Vernon' in daao_bios_df.iloc[i].FullName):
        artist_name = daao_bios_df.iloc[i].FullName
        tfidf_scores_artist = tfidf_scores[i]

        # Sort terms based on TF-IDF scores
        sorted_indices = tfidf_scores_artist.argsort()[::-1]
        distinctive_terms = [terms[idx] for idx in sorted_indices[:num_distinctive_terms]]

        # print(f"{artist_name}: {distinctive_terms}")

        # Step 7: Generate word cloud
        wordcloud = WordCloud(background_color='white').generate(' '.join(distinctive_terms))
        plt.figure()
        plt.imshow(wordcloud, interpolation='bilinear')
        plt.axis('off')
        plt.title(f"DAAO wordcloud: {artist_name}")
        plt.show()